
National Real Estate Commentary
U.S. existing-home sales improved for the second month in a row, jumping 9.5% to a seasonally adjusted annual rate of 4.38 million units, exceeding economists’ expectations and marking the largest monthly gain in a year, according to the National Association of REALTORS®(NAR). The rebound in home sales comes amid fluctuating mortgage rates and elevated sales prices, indicating there is plenty of buyer demand heading into the spring selling season.
The recent surge in home sales was likely due to a dip in mortgage rates in December and an increase in housing supply nationwide. According to NAR, total inventory grew 5.9% month-over-month and 10.3% year-over-year to 1.07 million units, for a 2.9 months’ supply at the current sales pace. Buyer demand remains robust, and the limited supply of inventory helped push the median existing-home sales price up 5.7% year-over-year to $384,500, the eighth consecutive month of annual price increases.
March-Local Activity
Locally, single-family home sales also increased month-over-month for the second month in a row. However, year-over-year, Closed Sales decreased 16.0 percent for Residential homes and 11.7 percent for Condo homes. Pending Sales decreased 2.5 percent for Residential homes and 6.3 percent for Condo homes. Inventory increased 1.6 percent for Residential homes and 10.0 percent for Condo homes.
The Median Sales Price increased 7.5 percent to $247,275 for Residential homes and 8.3 percent to $260,000 for Condo homes. Days on Market decreased 9.1 percent for Residential homes and 7.0 percent for Condo homes. Months-Supply of Inventory increased 6.7 percent for Residential homes and 11.1 percent for Condo homes.
“Despite a continued competitive marketplace there are positive signs of increasing consumer enthusiasm and decreasing reticence as we prepare to enter the annual buying/selling season,” said Karen S. Kage, CEO of Realcomp. “That includes more homes coming to market, less days on market, and median sales prices that continue their rise month-to-month and year-over-year.
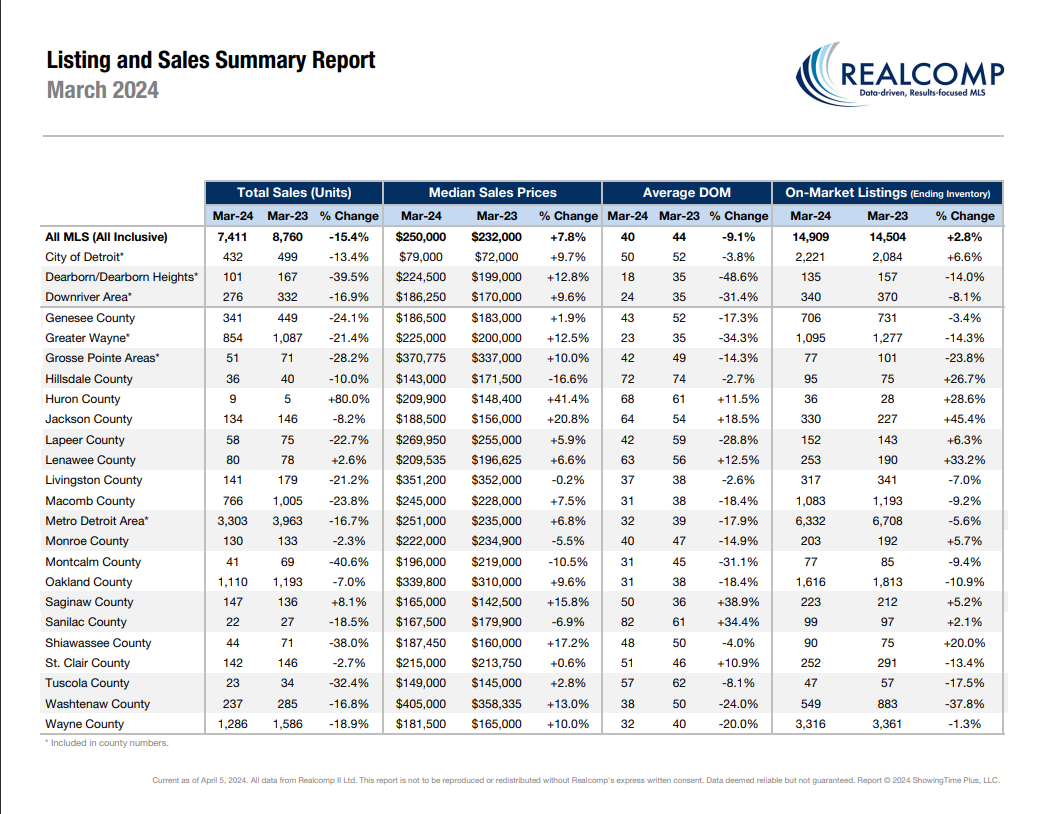
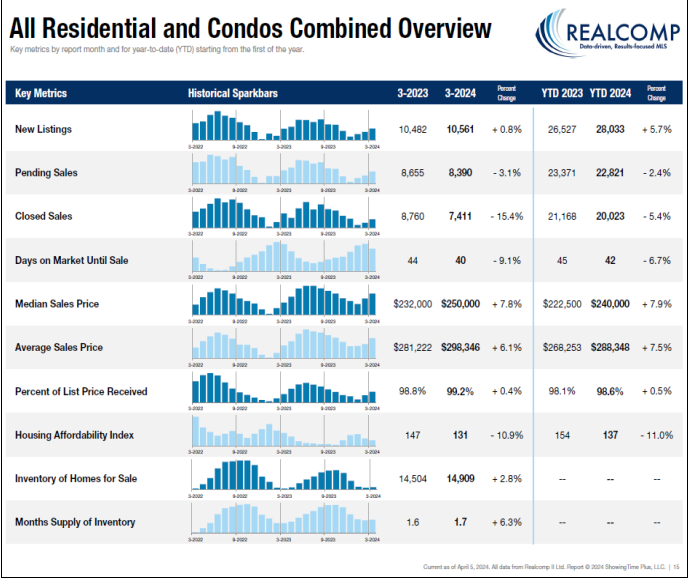
March Y-O-Y Comparison -- Residential & Condos Combined -- All MLS
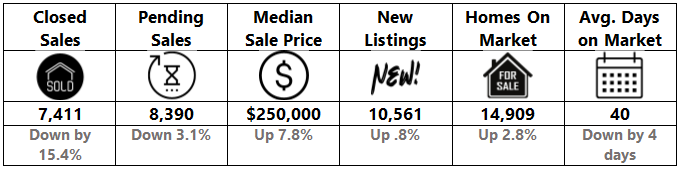
- New Listings increased by .8% from 10,482 to 10,561.
- Pending Sales decreased by 3.1% from 8,655 to 8,390.
- Closed Sales decreased by 15.4% from 8,760 to 7,411.
- Average days on Market (DOM) decreased by 4 days to 40 days.
- Median Sale Price increased by 7.8% from $232,000 to $250,000.
- Percentage of last list price received increased slightly by .4% from 98.8% to 99.2%.
- Inventory of Homes for Sale increased by 2.8% from 14,504 to 14,909.
- Months-Supply of Inventory increased by 6.3% from 1.6 to 1.7.
- Average Showings per Home decreased from 12.1 to 11.3.
- Listings that were both listed and pended in the same month were at 4,300. This represents 40.7% of the new listings for the month and 51.3% of the pended listings.
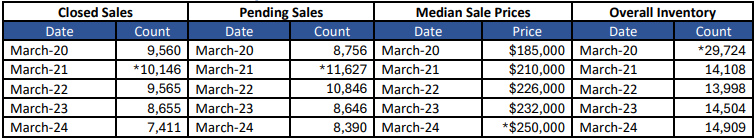
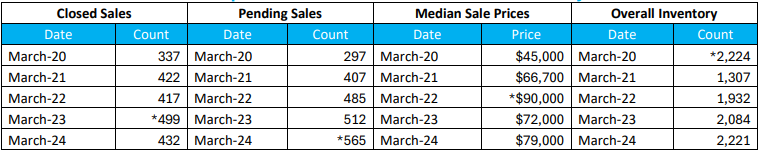
March 5-Year Perspectives -- Residential & Condos Combined -- All MLS
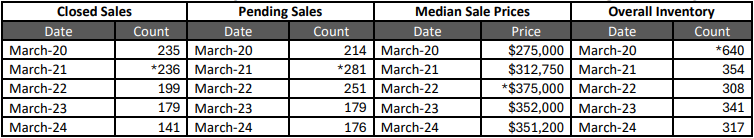
March 5-Year Perspectives -- Residential & Condos Combined – City of Detroit Numbers
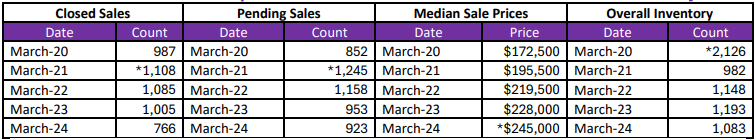
March 5-Year Perspectives -- Residential & Condos Combined -- Livingston County
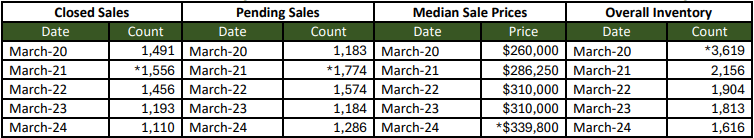
March 5-Year Perspectives -- Residential & Condos Combined -- Macomb County Numbers
March 5-Year Perspectives -- Residential & Condos Combined -- Oakland County Numbers
March 5-Year Perspectives -- Residential & Condos Combined -- Wayne County Numbers
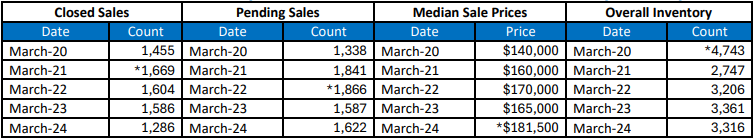
*high points noted with an asterisk.
Note: These numbers represent real estate market activity in the lower part of Michigan. Be sure to contact a REALTOR® for their expertise about local markets. Find a REALTOR® in your market at www.MoveInMichigan.com.
Realcomp Shareholder Boards & Associations of REALTORS®:
- DABOR, Andrea Kuentz, Interim CEO, 313-278-2220
- DAR, Sharon Armour, EVP, 313-962-1313
- ETAR, Laura VanHouteghen, 810-982-6889
- GPBR, Bob Taylor, CEO, 313-882-8000
- LUTAR, 810-664-0271
- LCAR, Terri Fratarcangeli, EVP, 810-225-1100
- NOCBOR, Patricia Jacobs, EVP, 248-674-4080