
National Real Estate Commentary
U.S. existing-home sales grew 3.1% month-over-month to a seasonally adjusted annual rate of 4.00 million, exceeding economists’ expectations and marking the strongest sales pace since August 2023, according to the National Association of REALTORS® (NAR). Falling interest rates late last year, coupled with a recent uptick in inventory, helped existing-home sales to climb following last month’s decline, with monthly gains reported in the Midwest, South, and West regions.
Total inventory heading into February stood at 1.01 million units, a 2% increase from the previous month and a 3.1% increase from the same time last year, for a 3 months’ supply at the current sales pace, according to NAR.
Although buyers may find additional options in their home search, inventory remains below the 5-6 months’ supply of a balanced market, and demand is exceeding supply. As a result, existing-home sales prices have continued to rise, climbing 5.1% year-over-year to $379,100.
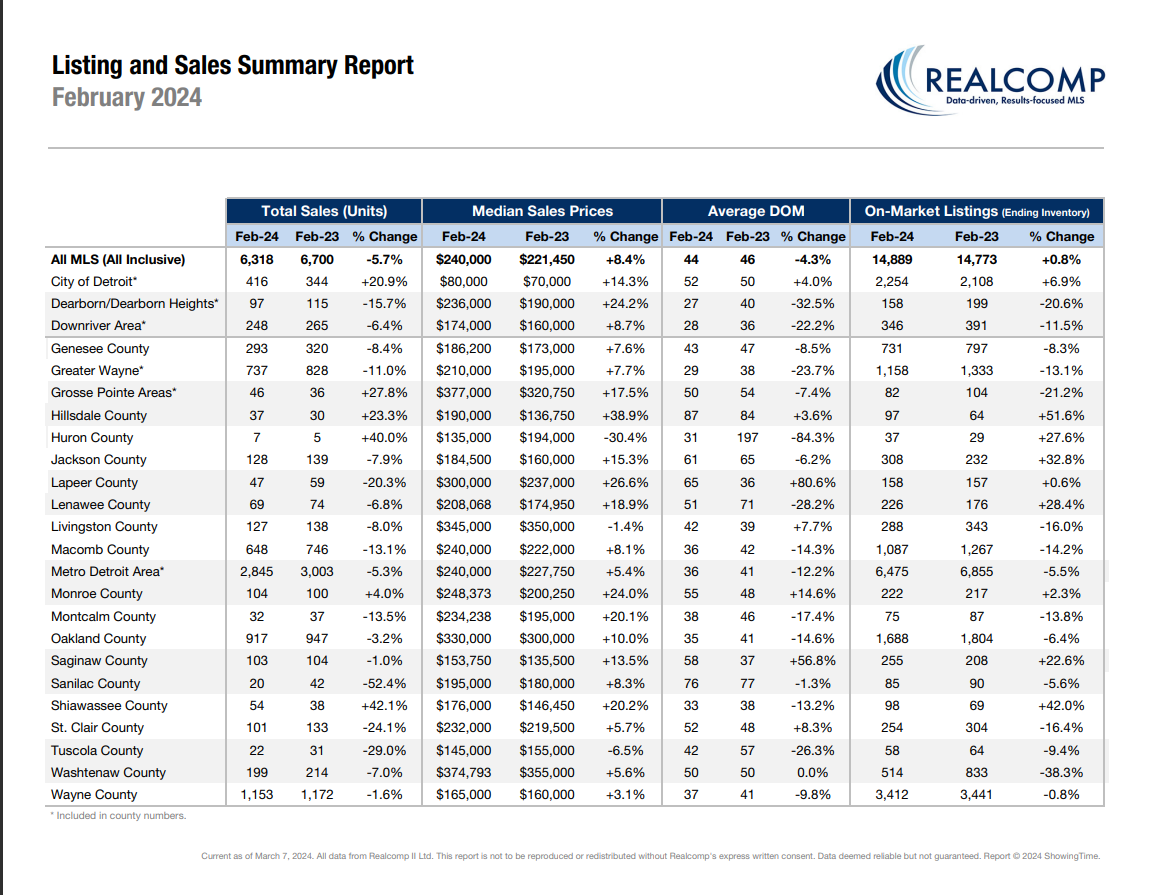
February-Local Activity
Closed Sales decreased 6.7 percent for Residential homes but increased 1.6 percent for Condo homes. Pending Sales decreased 3.4 percent for Residential homes but increased 1.7 percent for Condo homes. Inventory decreased 0.3 percent for Residential homes but increased 7.6 percent for Condo homes.
The Median Sales Price increased 8.6 percent to $239,900 for Residential homes and 11.1 percent to $250,000 for Condo homes. Days on Market decreased 6.4 percent for Residential homes but increased 7.1 percent for Condo homes. Months-Supply of Inventory increased 13.3 percent for Residential homes and 5.6 percent for Condo homes.
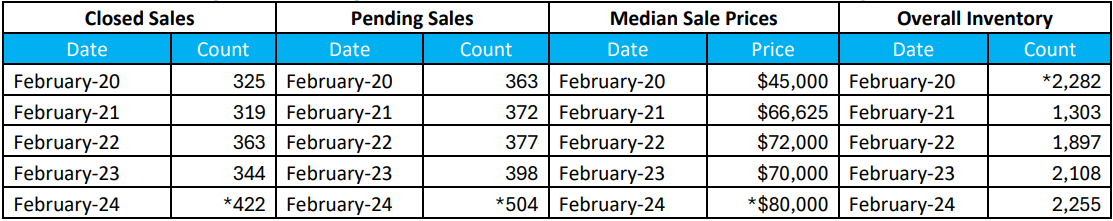
“New home listings appear to be trending in the right direction once again this month,” said Karen S. Kage, CEO of Realcomp. “At the same time, Detroit continues to thrive with 5-year February highs in closed sales, pending sales, and a median sales price of $80,000.”
February Y-O-Y Comparison -- Residential & Condos Combined -- All MLS
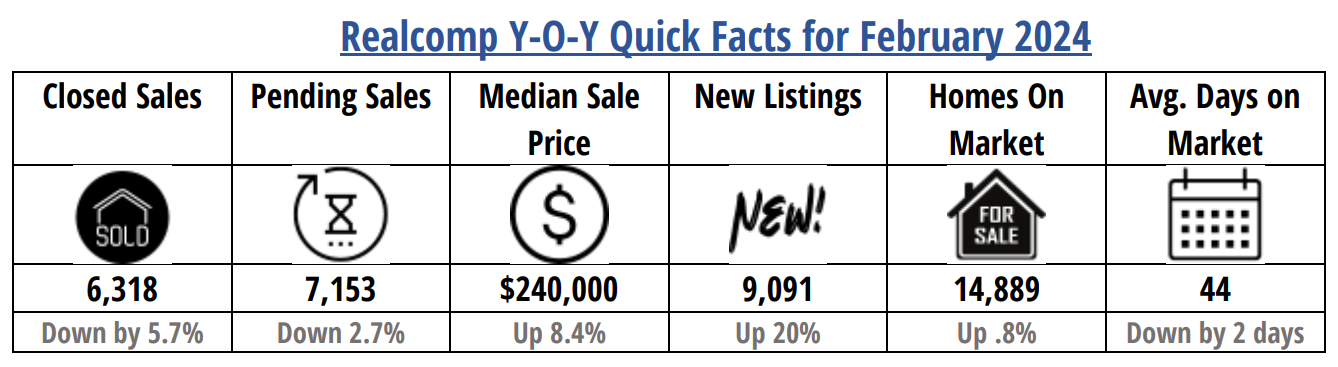
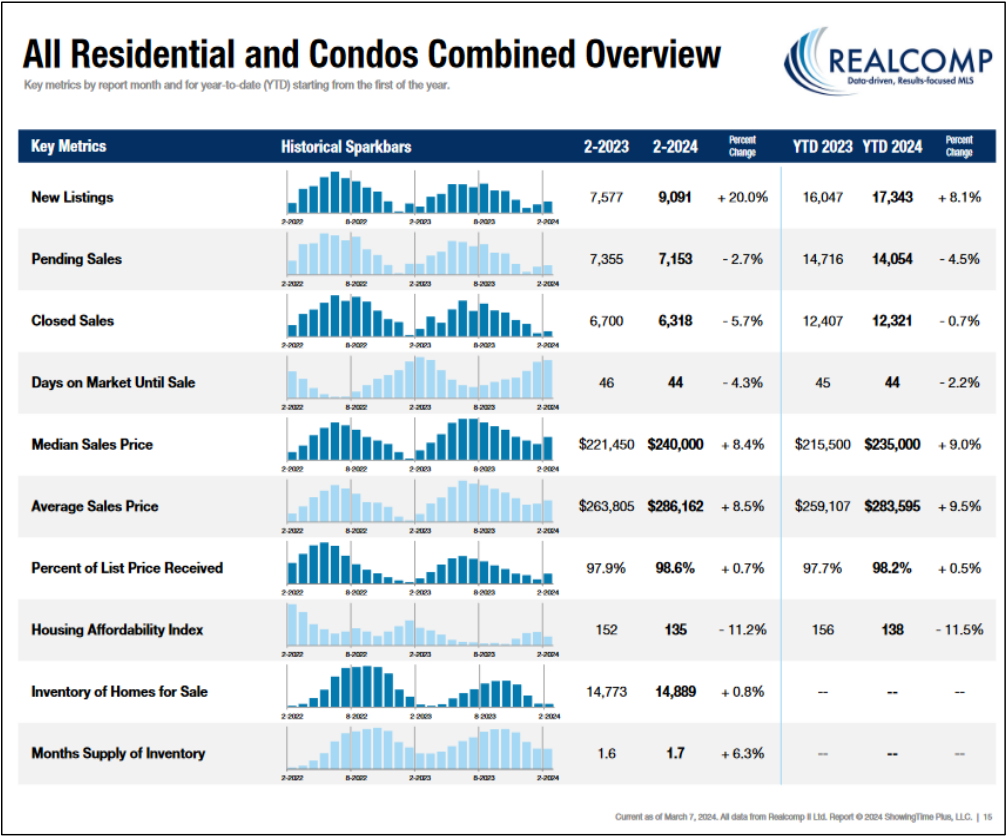
- New Listings decreased by 20% from 7,577 to 9,091.
- Pending Sales decreased by 2.7% from 7,355 to 7,153.
- Closed Sales decreased by 5.7% from 6,700 to 6,318.
- Average days on Market (DOM) decreased by 2 days at 44 days.
- Median Sale Price increased by 8.4% from $221,450 to $240,000.
- Percentage of last list price received increased slightly by .7% from 97.9% to 98.6%.
- Inventory of Homes for Sale increased by .8% from 14,773 to 14,889.
- Months-Supply of Inventory increased by 6.3% from 1.6 to 1.7.
- Average Showings per Home increased ever so slightly from 10.2 to 10.3.
- Listings that were both listed and pended in the same month were at 3,180. This represents 35.0% of the new listings for the month and 44.5 of the pended listings.
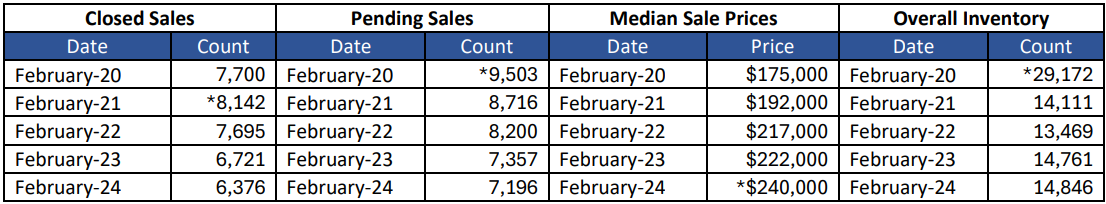
February 5-Year Perspectives -- Residential & Condos Combined -- All MLS
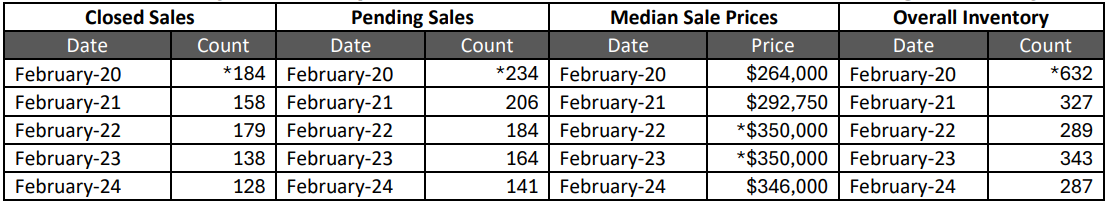
February 5-Year Perspectives -- Residential & Condos Combined – City of Detroit Numbers
February 5-Year Perspectives -- Residential & Condos Combined -- Livingston County
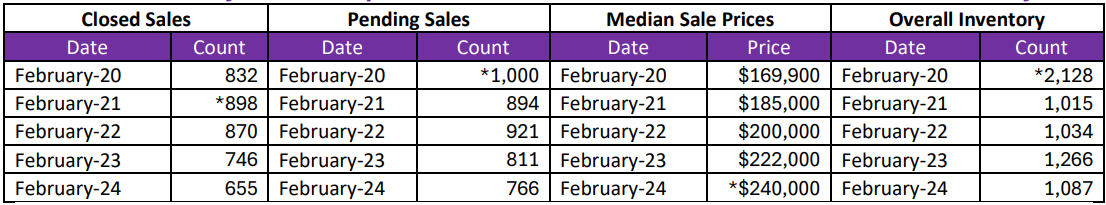
February 5-Year Perspectives -- Residential & Condos Combined -- Macomb County Numbers
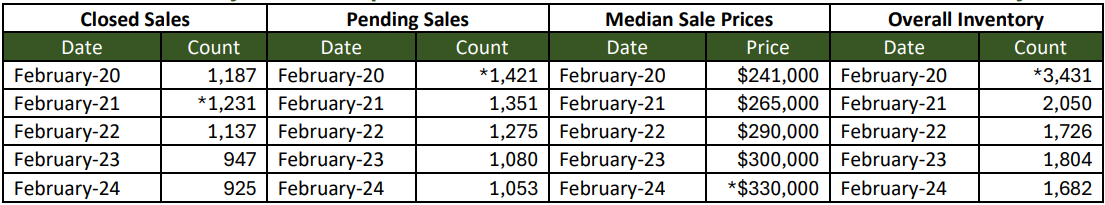
February 5-Year Perspectives -- Residential & Condos Combined -- Oakland County Numbers
February 5-Year Perspectives -- Residential & Condos Combined -- Wayne County Numbers
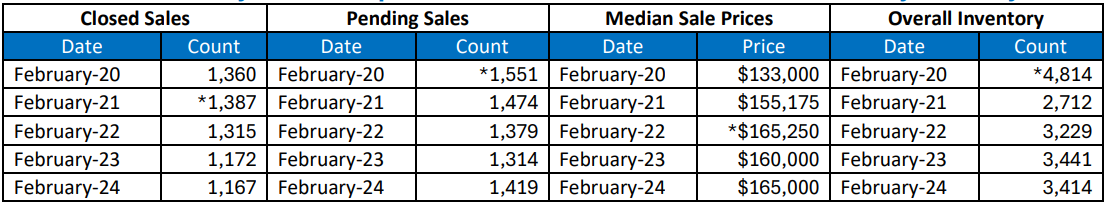
*high points noted with an asterisk.
Note: These numbers represent real estate market activity in the lower part of Michigan. Be sure to contact a REALTOR® for their expertise about local markets. Find a REALTOR® in your market at www.MoveInMichigan.com.
Realcomp Shareholder Boards & Associations of REALTORS®:
- DABOR, Andrea Kuentz, Interim CEO, 313-278-2220
- DAR, Sharon Armour, EVP, 313-962-1313
- ETAR, Laura VanHouteghen, 810-982-6889
- GPBR, Bob Taylor, CEO, 313-882-8000
- LUTAR, 810-664-0271
- LCAR, Pam Leach, EVP, 810-225-1100
- NOCBOR, Patricia Jacobs, EVP, 248-674-4080