|
MarketStats is another value-added product available to Realcomp subscribers that provides you with a powerful array of statistical tools, all accessible with just a few clicks of your mouse!
A great place to get started with MarketStats is FastStats. As the name suggests, FastStats provides easy-to-access statistical summaries (over 500 of them) in just a few quick steps!
To access these reports, choose ShowingTime MarketStats from the Realcomp dashboard.

Next on the Market Stats menu, select FastStats.

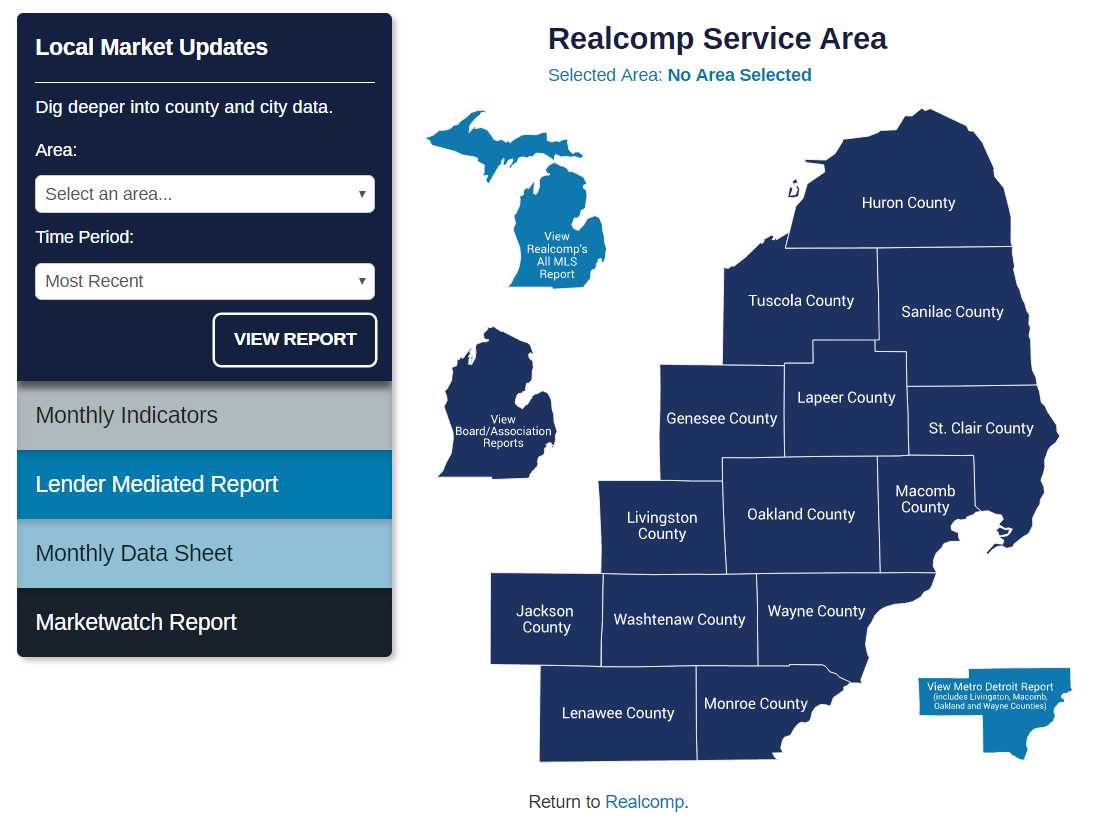
Use the drop-down menu to then select your AREA and TIME PERIOD or use the graphical interface to choose your county and city/village/township.

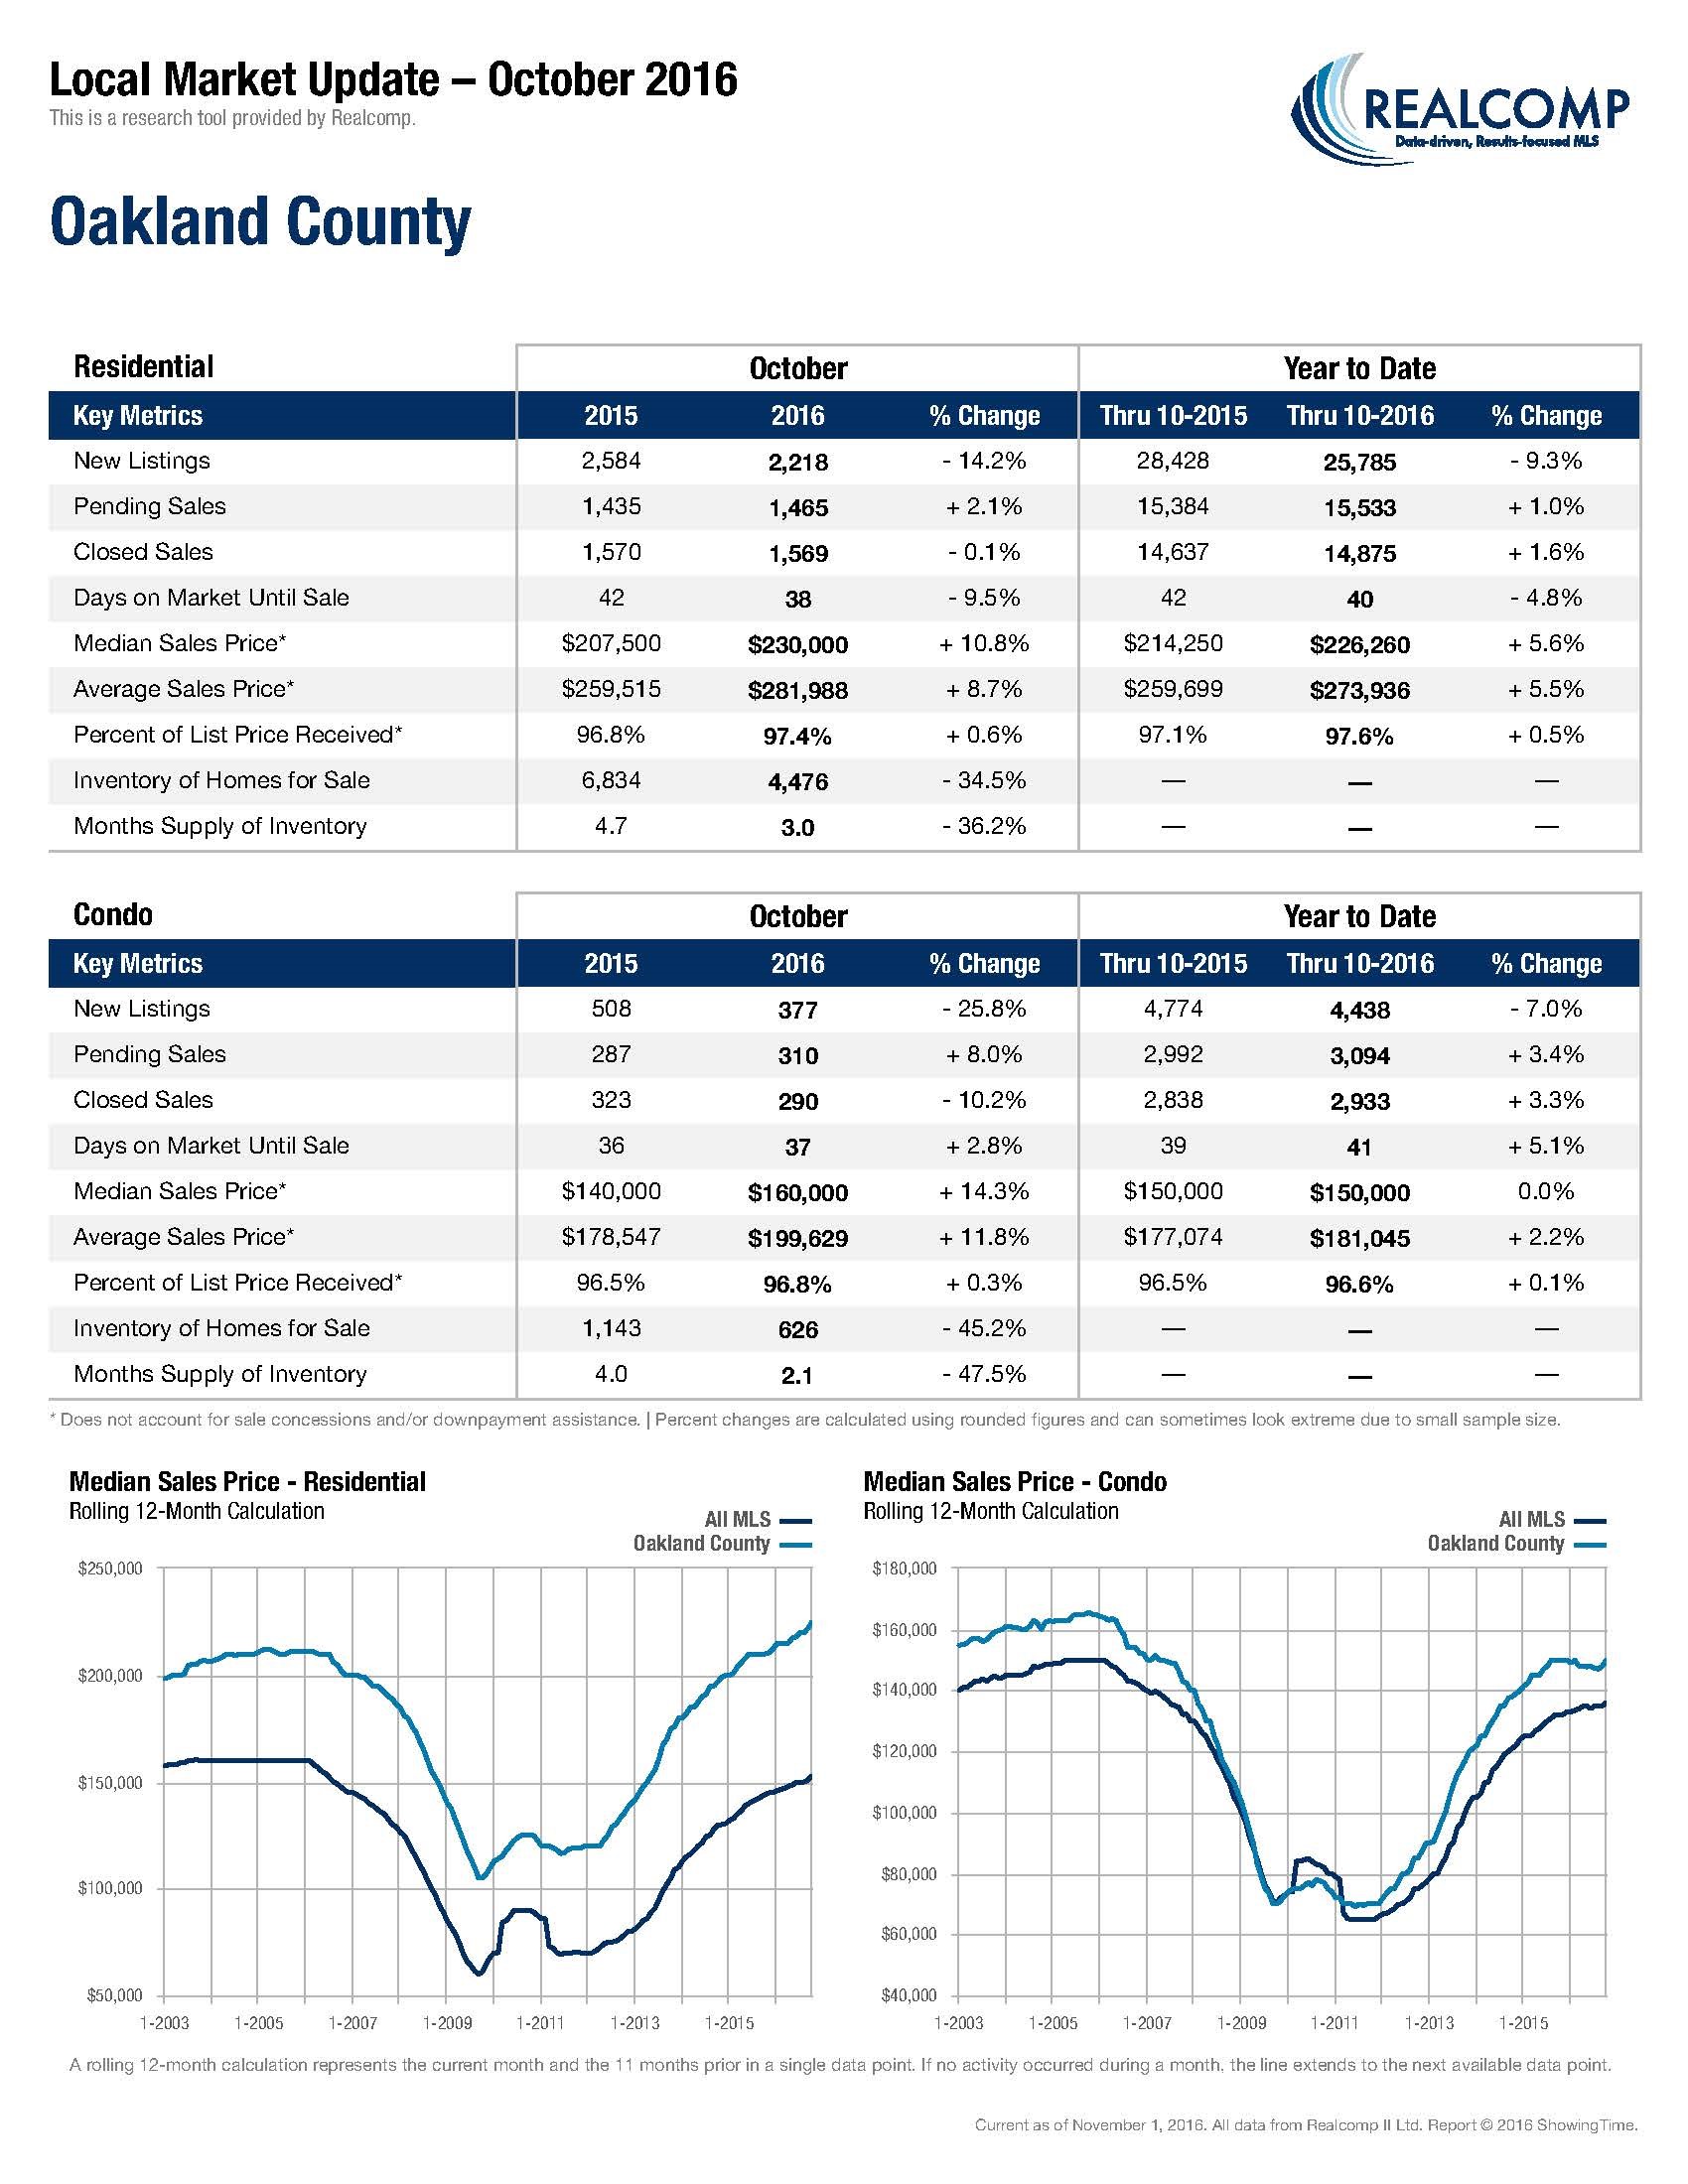
You are now ready to VIEW REPORT (sample report shown below):

Within the FastStats menu, you may also choose from the following report options:
- Monthly Indicators – A 15-page report that nicely summarizes key indicators (i.e. inventory, days on market, sales, sales prices, etc.) of the market.
- Lender Mediated Report – A 5-page report that allows you to compare traditional sales to foreclosure and short sales in the region.
- Monthly Data Sheet – A quick 1-page report of the SE Michigan market and county break downs.
- Marketwatch Report (quarterly) – A quarterly look at key metrics for counties and ZIP codes in the region.
Using these reports can serve to educate your clients about market conditions that can affect their house sale and/or purchase, ultimately making your job easier. Try using them in the following ways:
- Post on your website to report on the market
- Use in your blog and social media posts—a great way to draw people in and start conversation on the current trends (i.e. inventory, sales price, etc.)
- Send out to past clients
- Hand out at open houses and be sure to attach your business card
- Include as an additional page in your CMA – use this as a reference when making list price recommendations
- Appraisers: Reference in your appraisal report
|