Navigating NovemberBuyers, Sellers Work to Set a Course through Rising Mortgage Rate
November – National Real Estate Commentary
Housing affordability continues to be a major roadblock for market participants, with mortgage rates more than double compared to this time last year. Buyers are delaying home purchases in hopes rates will drop, while many sellers are holding off on listing their homes due to weakening buyer demand, unwilling to trade in their current lower rates for significantly higher borrowing costs on their next property. As a result, existing-home and pending home sales have continued to slow as we move into winter.
Closed Sales decreased 31.1 percent for Residential homes and 31.0 percent for Condo homes. Pending Sales decreased 31.2 percent for Residential homes and 28.2 percent for Condo homes. Inventory increased 11.6 percent for Residential homes and 3.6 percent for Condo homes. The Median Sales Price remained flat for Residential homes and increased 14.3 percent to $240,000 for Condo homes. Days on Market increased 22.2 percent for Residential homes and 9.4 percent for Condo homes. Months-Supply of Inventory increased 25.0 percent for Residential homes and 18.8 percent for Condo homes.
With home sales down, nationwide housing inventory was at 3.3 months’ supply heading into November, up from 2.4 months from this time last year, according to the National Association of REALTORS®. Although buyers have more options to choose from, home prices remain high, and soaring borrowing costs have caused monthly payments to increase significantly, with the average homebuyer paying 77% more on their loan per month compared to the same period a year ago, according to Realtor.com.
November Y-O-Y Comparison -- Residential & Condos Combined -- All MLS
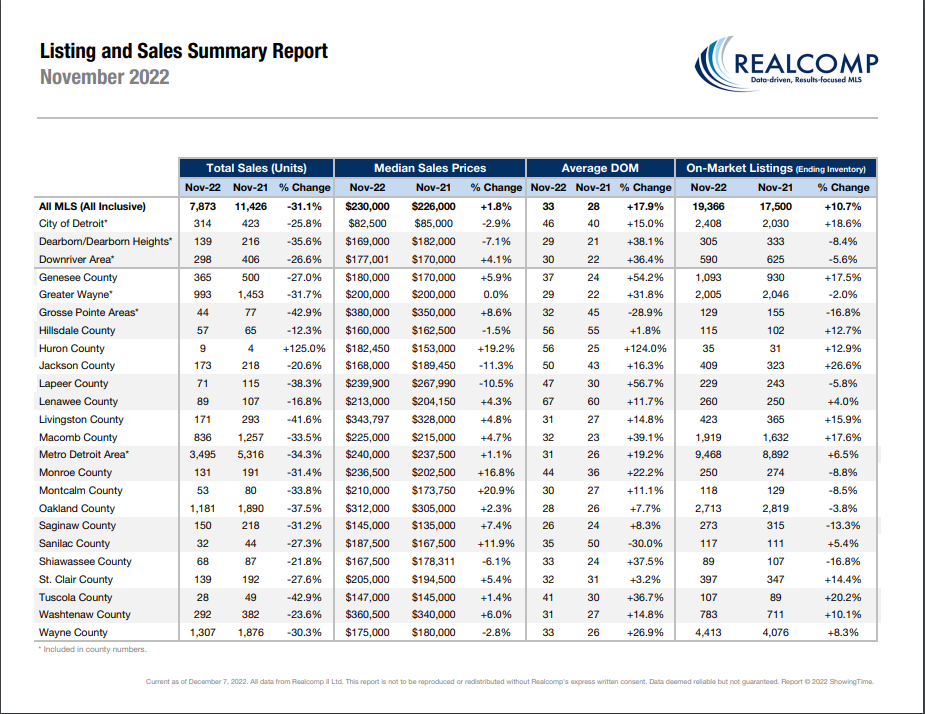
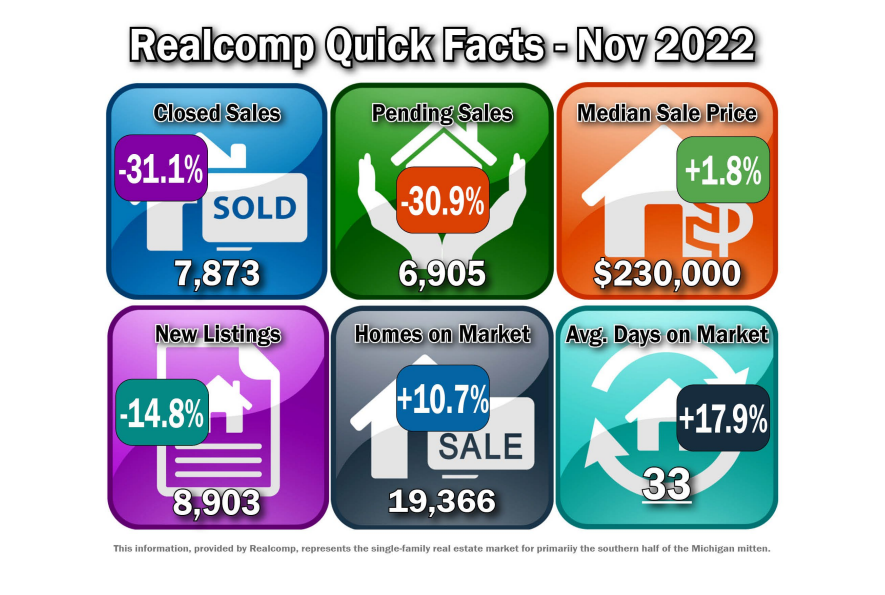
Median Sales Price increased by 1.8% from $226,000 to $230,000.
The average days on market (DOM) increased by 5 days from 28 to 33.
The average % of the last list price received decreased by 1.6% from 99.7% to 98.1%.
New Listings decreased by 14.8% from 10,449 to 8,903.
Average Showings per Home decreased by 3.6 from 9.4 to 5.8.
Pending Sales decreased by 30.9% from 9,986 to 6,905.
Closed Sales decreased by 31.1% from 11,426 to 7,873.
Months-Supply of Inventory increased by 25% from 1.6 to 20.
Listings that were both listed and pended in the same month were at 2,524. This represents 28.3% of the new listings for the month and 36.6% of the pended listings.

November – Activity by Region or County
The Median Sale Price for the Metro Detroit area (Livingston, Macomb, Oakland, & Wayne combined) increased to $240,000, up by 1.1% over last November, based on 3,495 sales. Listings spent an average of 31 days on the market, up 5 days compared to last November
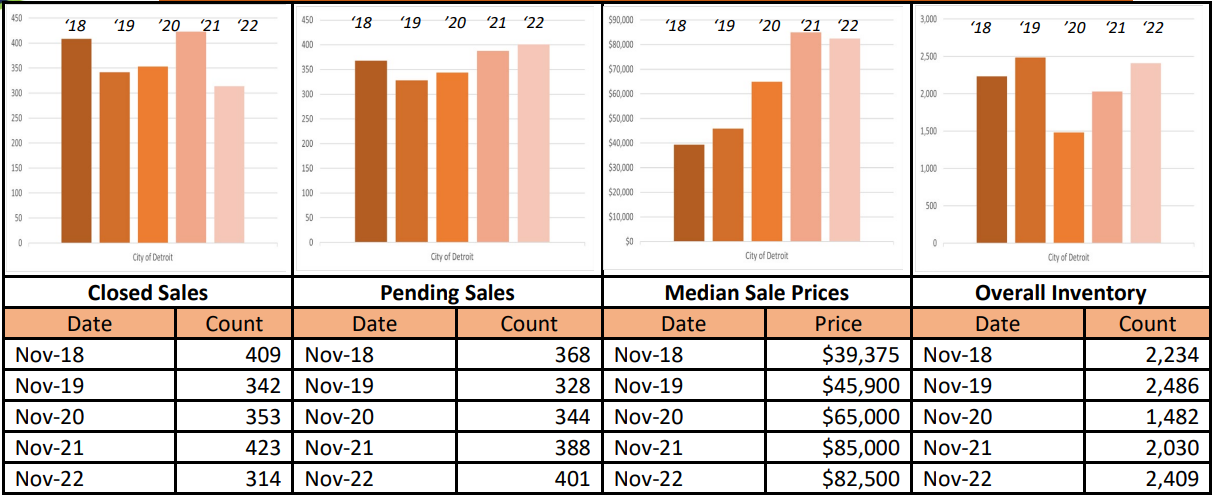
The Median Sale Price for the City of Detroit decreased to $82,500, down by 2.9% over last November, based on 314 sales. Listings spent an average of 46 days on the market, up from 40 days compared to last November.
The Median Sale Price for Lapeer County decreased to $239,900, down by 10.5% over last November, based on 71 sales. Listings spent an average of 47 days on the market, up from 30 days compared to last November.
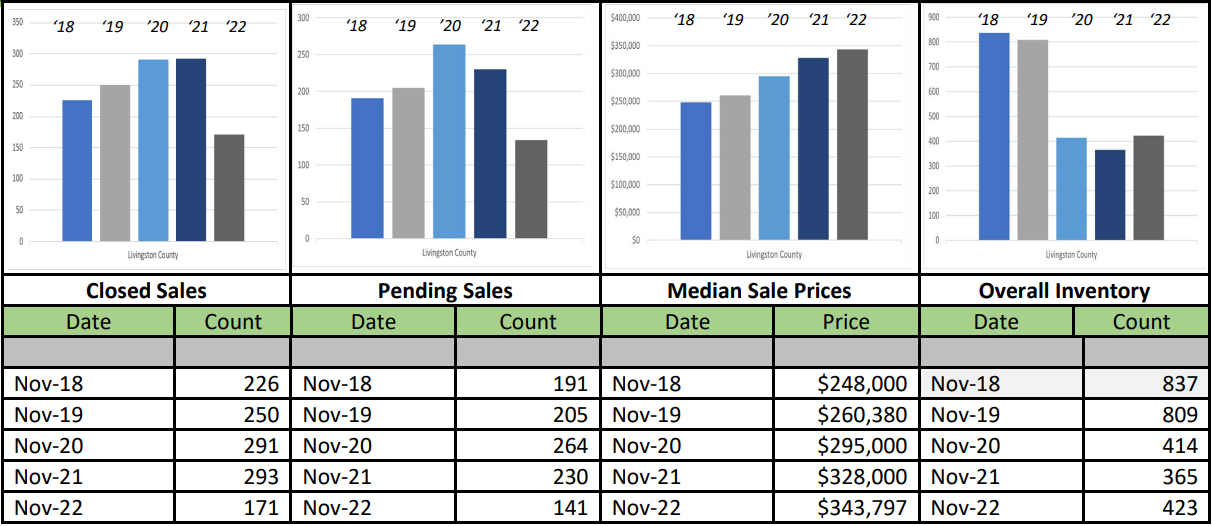
The Median Sale Price for Livingston County increased to $343,797, up by 4.8% over last November, based on 171 sales. Listings spent an average of 31 days on the market, up by 4 days compared to last November
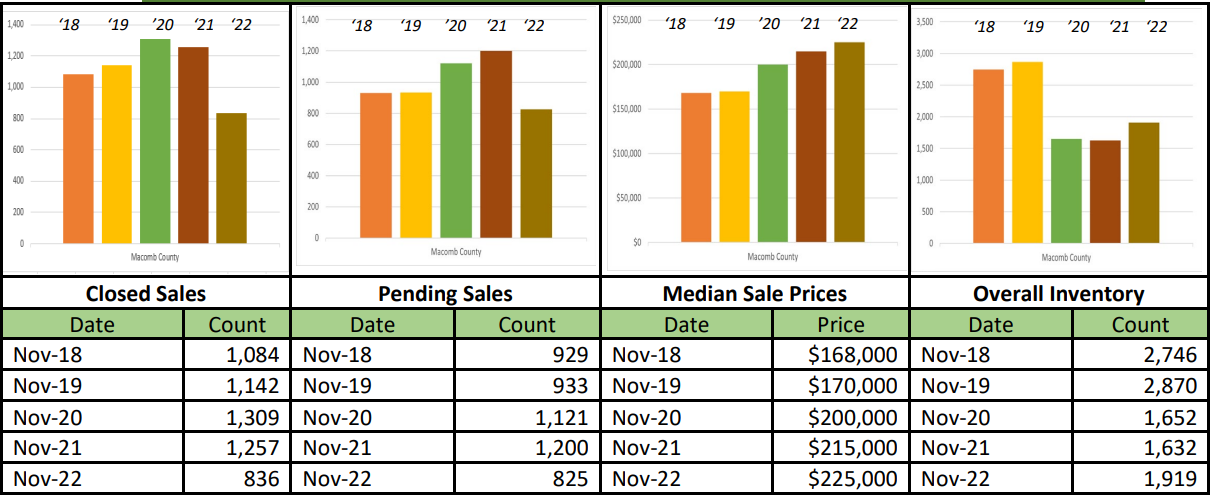
The Median Sale Price for Macomb County increased to $225,000, up by 4.7% over last November, based on 836 sales. Listings spent an average of 32 days on the market, up 9 days compared to last November.
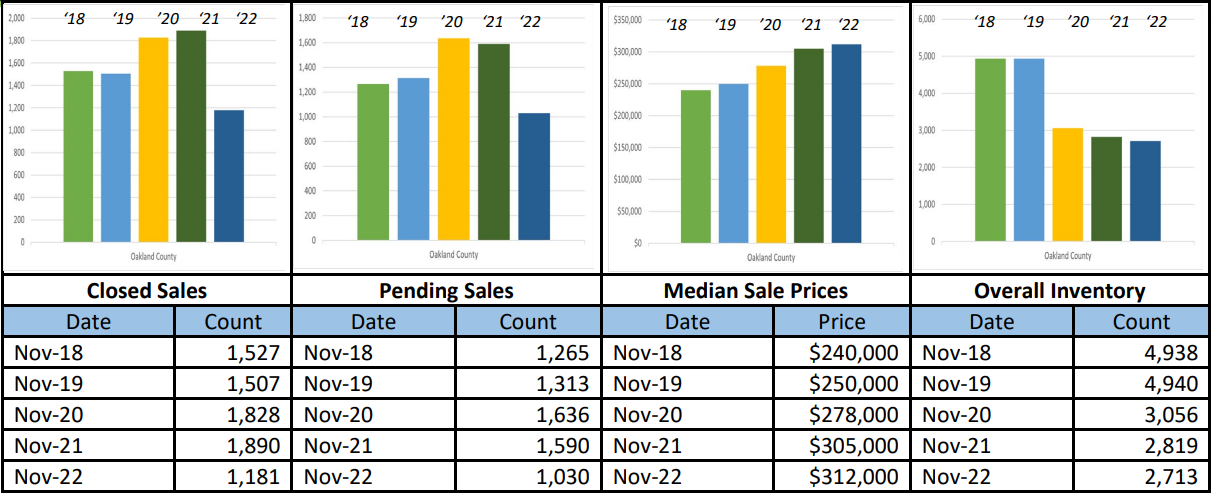
The Median Sale Price for Oakland County increased to $312,000, up by 2.3% over last November, based on 1,181 sales. Listings spent an average of 28 days on the market, up 2 days compared to last November
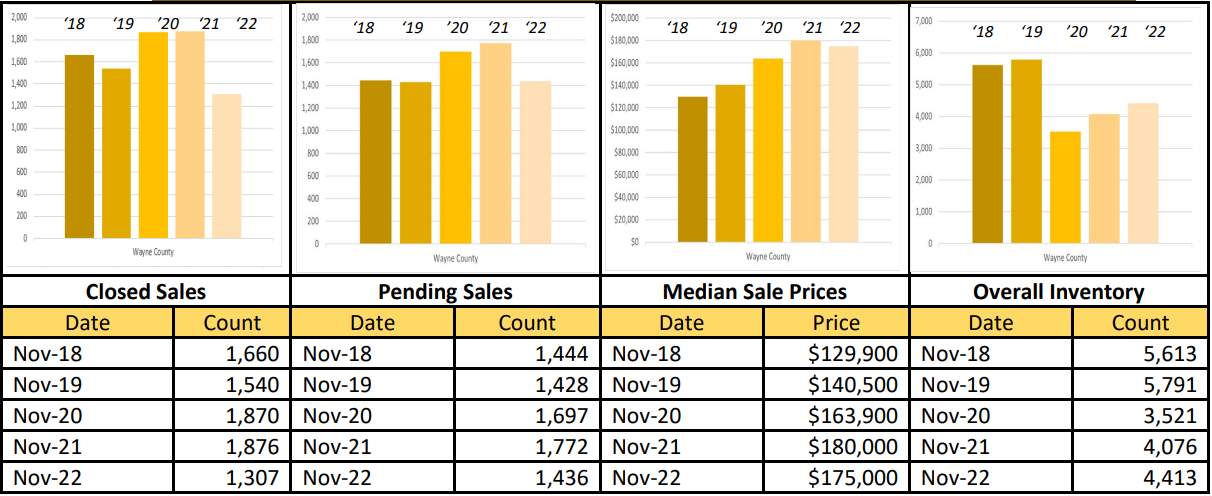
The Median Sale Price for Wayne County decreased to $175,000, down by 2.8% over last November, based on 1,307 sales. Listings spent an average of 33 days on the market, up 7 days compared to last November.
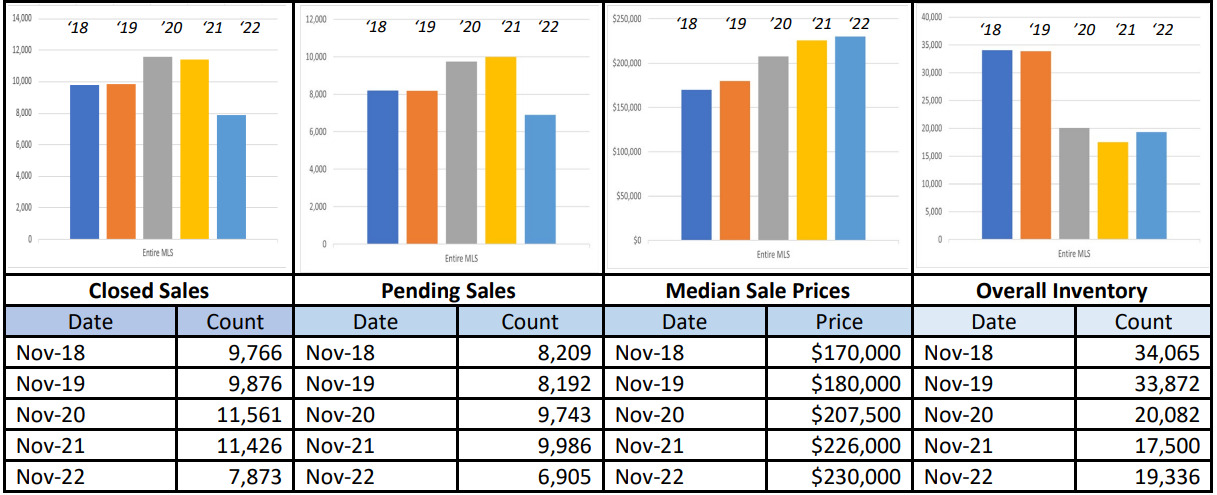
November 5-Year Perspectives -- Residential & Condos Combined -- All MLS
November 5-Year Perspectives -- Residential & Condos Combined -- Livingston County
November 5-Year Perspectives -- Residential & Condos Combined -- Macomb County Numbers
November 5-Year Perspectives -- Residential & Condos Combined -- Oakland County Numbers
November 5-Year Perspectives -- Residential & Condos Combined -- Wayne County Numbers
November 5-Year Perspectives -- Residential & Condos Combined – City of Detroit Numbers
It’s important to note that these numbers present a high-level view of what is happening in the real estate market in the lower part of Michigan and in specific regions. Be sure to contact a REALTOR® for their expertise about local markets.
Realcomp Shareholder Boards & Associations of REALTORS®:
- DABOR, 313-278-2220
- DAR, Sharon Armour, EVP, 313-962-1313
- ETAR, Laura VanHouteghen, 810-982-6889
- GMAR, Vickey Livernois, EVP, 248-478-1700
- GPBR, Bob Taylor, CEO, 313-882-8000
- LUTAR, 810-664-0271
- LCAR, Pam Leach, EVP, 810-225-1100
- NOCBOR, Patricia Jacobs, EVP, 248-674-4080