October Brings Marketplace CoolingMany Taking “Wait and See” Approach Amidst Higher Inflation and Higher Interest Rates
October – National Real Estate Commentary
Existing home sales declined nationwide for the eighth consecutive month, falling 1.5% as of last measure,
according to the National Association of REALTORS® (NAR), with sales down nearly 24% from the same period last year. Pending home sales also declined, dropping 10.9% month-to-month, exceeding economists’ expectations. Stubbornly high inflation and soaring borrowing costs have eroded buyer purchasing power and have caused the market to cool rapidly this year.
Locally, closed Sales decreased 27.1 percent for Residential homes and 23.3 percent for Condo homes. Pending Sales decreased 27.0 percent for Residential homes and 25.4 percent for Condo homes. Inventory increased 8.0 percent for Residential homes but decreased 0.5 percent for Condo homes.
The Median Sales Price increased 3.5 percent to $235,001 for Residential homes and 8.7 percent to $235,000 for Condo homes. Days on Market increased 19.2 percent for Residential homes but remained flat for Condo homes. Months-Supply of Inventory increased 16.7 percent for Residential homes and 11.8 percent for Condo homes.
The US housing market is undergoing a major shift, and affordability continues to be an obstacle for buyers and sellers. Mortgage rates have doubled since March, and home prices remain elevated due to a limited supply of homes, although price gains are slowing at a quickening pace. As a result, many homeowners are waiting until market conditions improve to sell their home, while other sellers are increasingly cutting prices and offering concessions to attract a greater number of buyers.
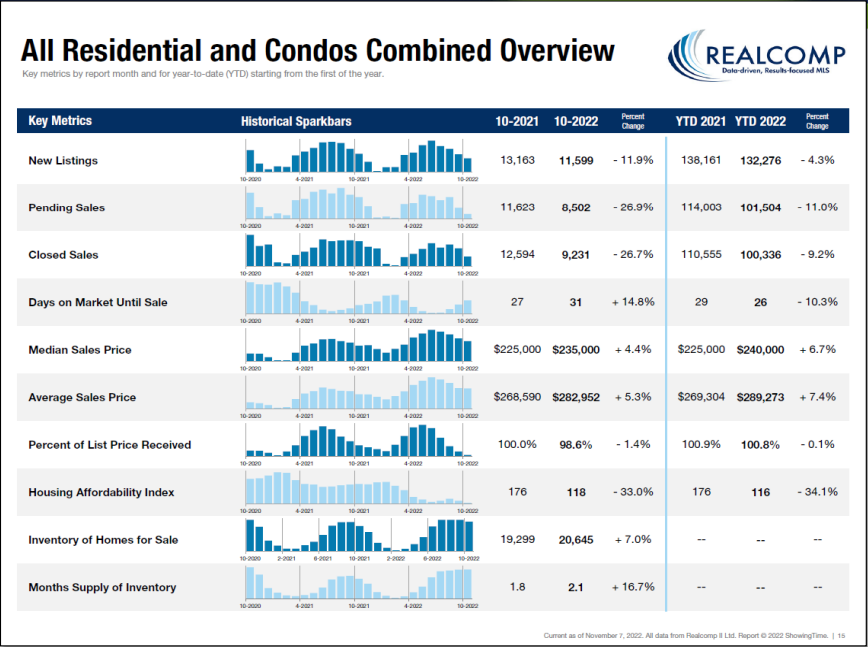
October Y-O-Y Comparison -- Residential & Condos Combined -- All MLS
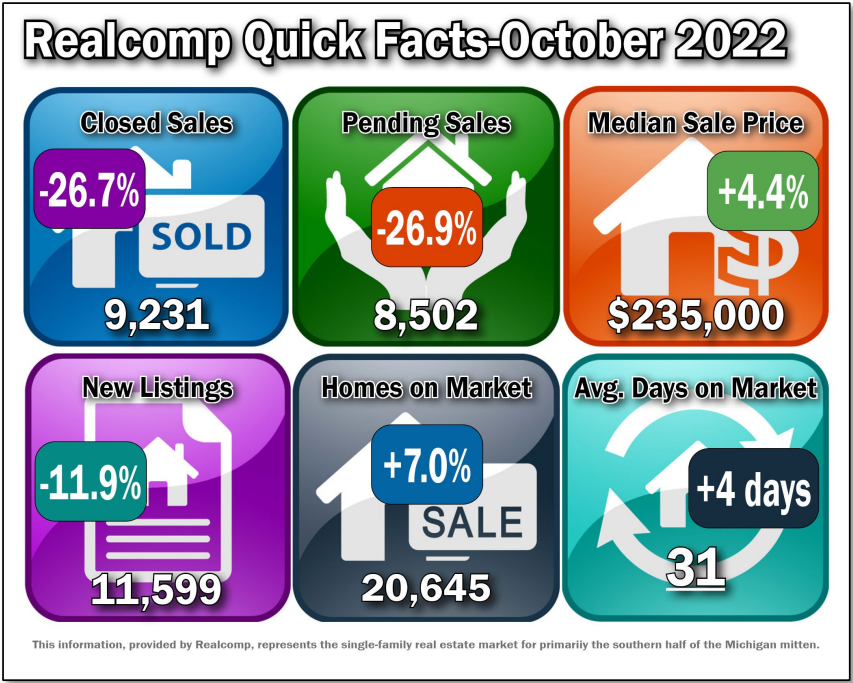
Median Sales Price increased by 4.4% from $225,000 to $235,000.
The average days on market (DOM) increased by 4 days from 27 to 31.
The average % of the last list price received decreased by 1.4% from 100% to 98.6%.
New Listings decreased by 11.9% from 13,163 to 11,599.
Average Showings per Home decreased by 3.6 from 9.9 to 6.3.
Pending Sales decreased by 26.9% from 11,623 to 8,502.
Closed Sales decreased by 26.7% from 12,594 to 9,231.
Listings that were both listed and pended in the same month were at 3,341. This represents 29% of the new listings for the month and 39.3% of the pended listings.
Months-Supply of Inventory increased by 16.7% from 1.8 to 2.1.
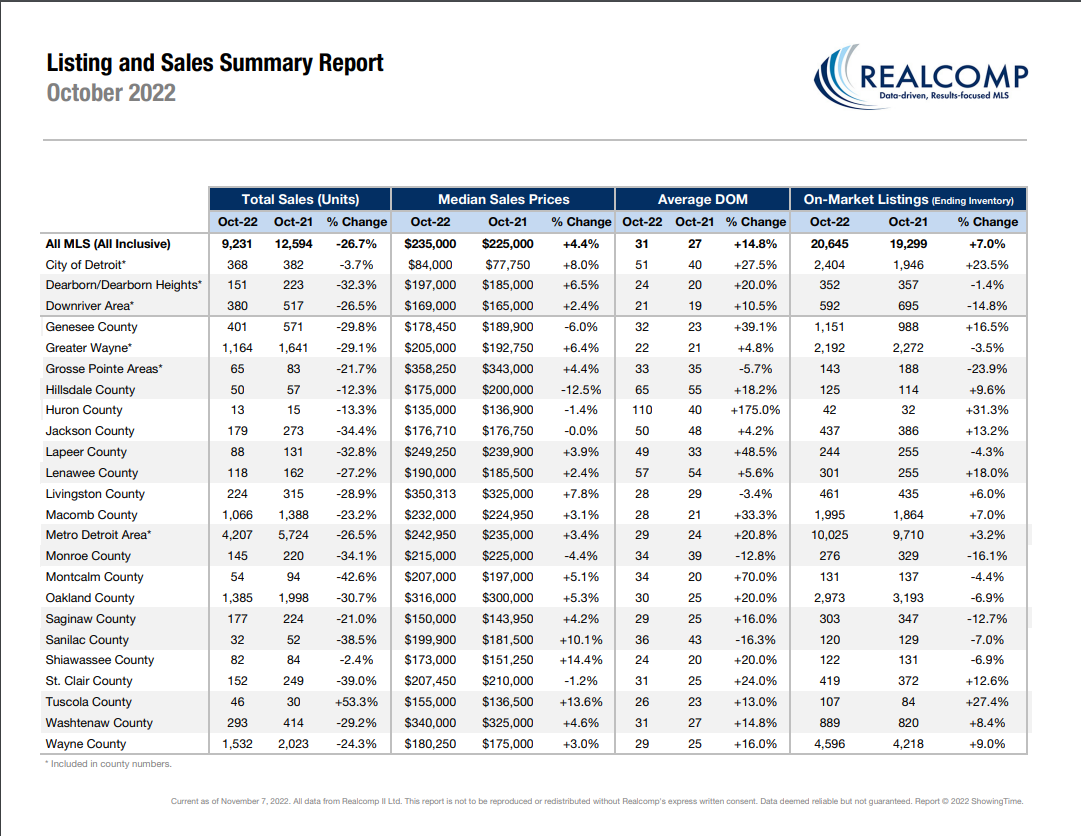
October – Activity by Region or County
The Median Sale Price for the Metro Detroit area (Livingston, Macomb, Oakland, & Wayne combined) increased to $242,950, up by 3.4% over last October, based on 4,207 sales. Listings spent an average of 29 days on the market, up 5 days compared to last October.
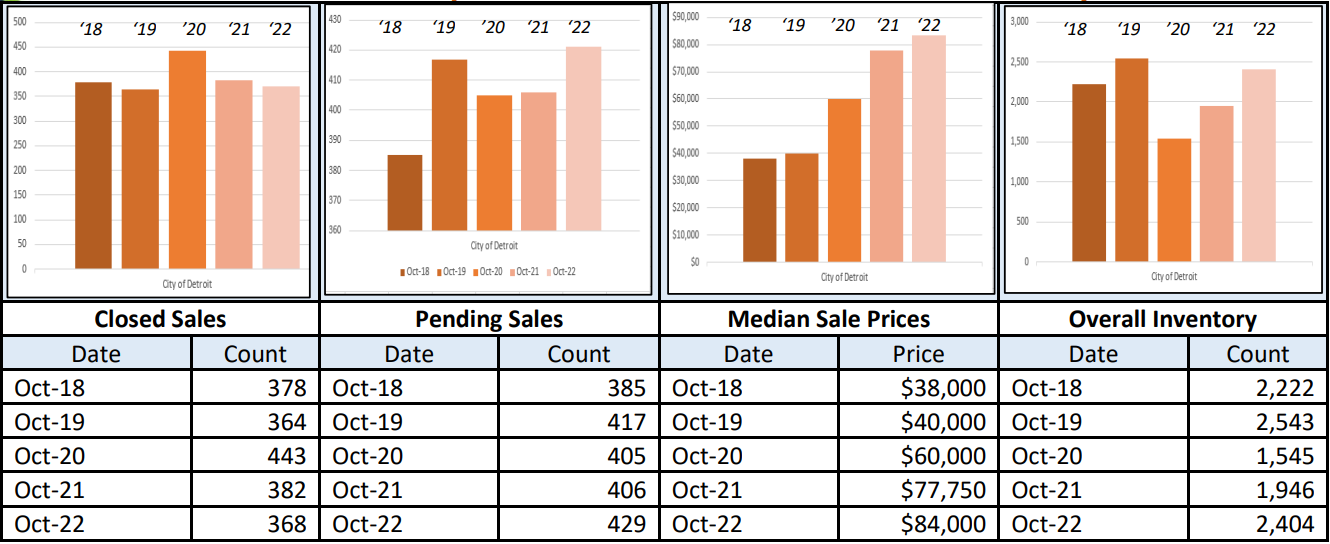
The Median Sale Price for the City of Detroit increased to $84,000, up by 8% over last October, based on 368 sales. Listings spent an average of 51 days on the market, up from 40 days compared to last October.
The Median Sale Price for Lapeer County increased to $249,250, up by 3.9% over last October, based on 88 sales. Listings spent an average of 49 days on the market, up from 16 days compared to last October.
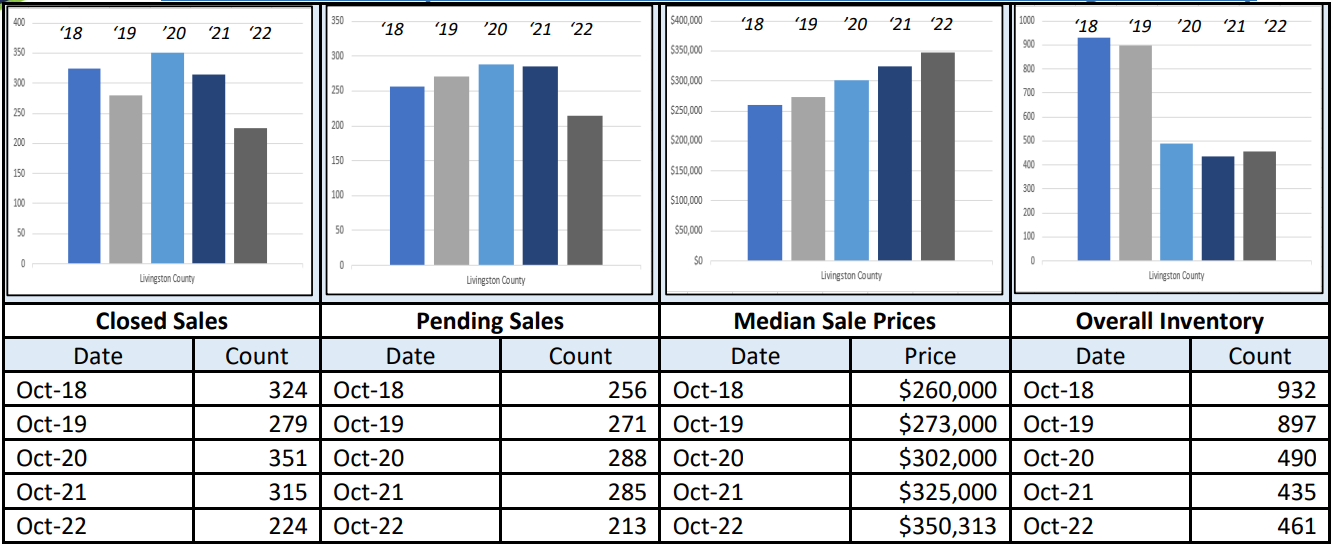
The Median Sale Price for Livingston County increased to $350,313, up by 7.8% over last October, based on 224 sales. Listings spent an average of 28 days on the market, down 1 day compared to last October.
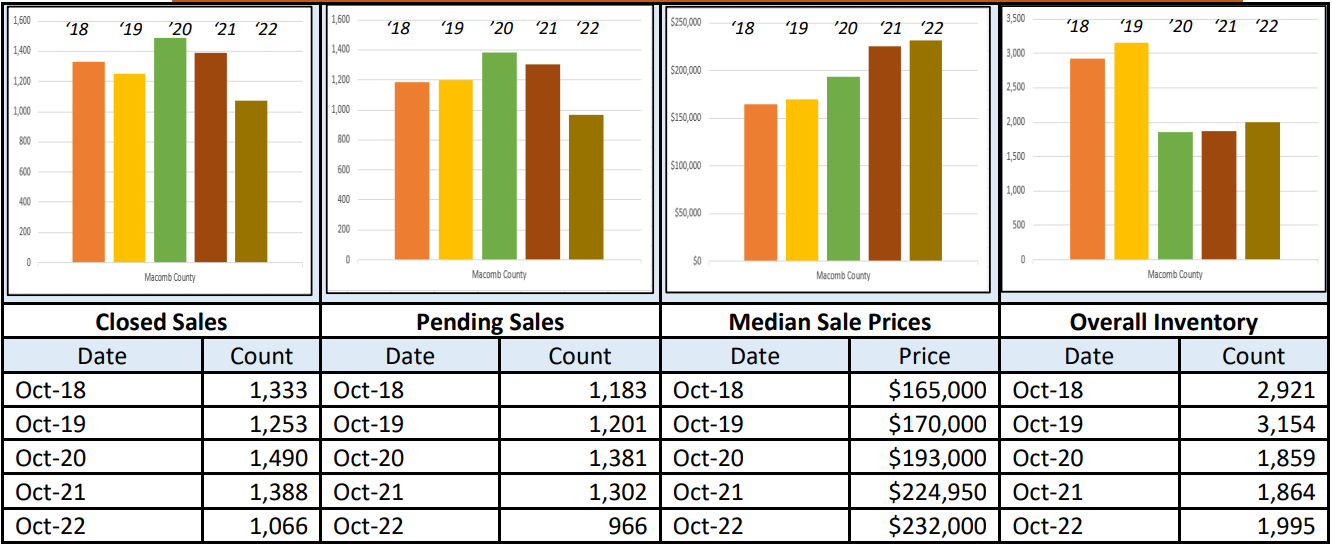
The Median Sale Price for Macomb County increased to $232,000, up by 3.1% over last October, based on 1,066 sales. Listings spent an average of 28 days on the market, up 7 days compared to last October.
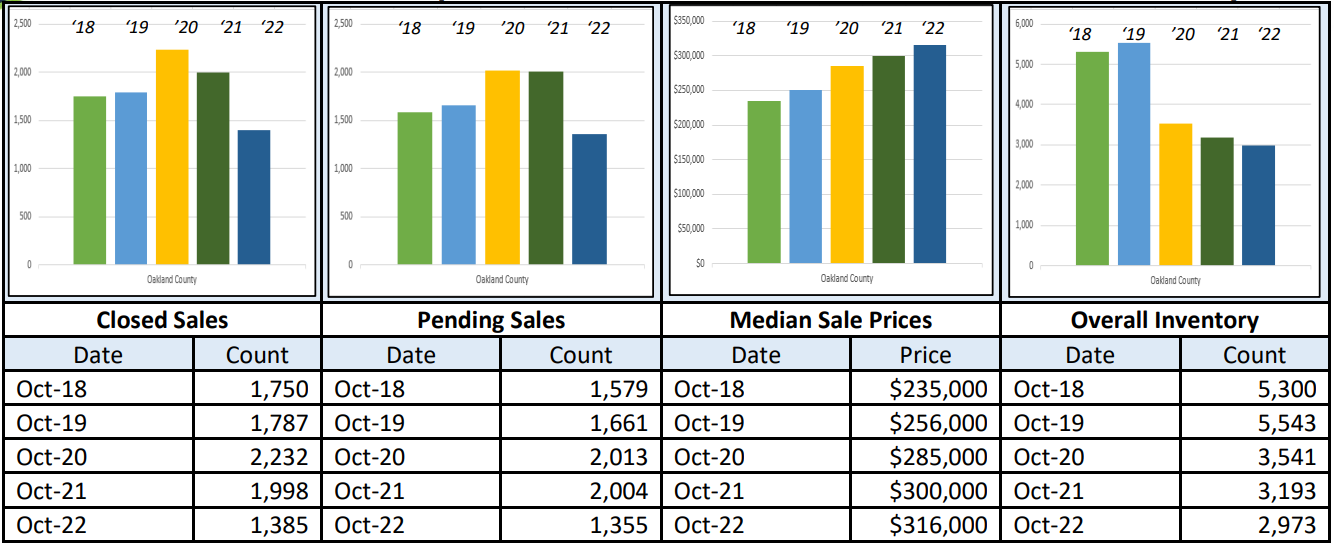
The Median Sale Price for Oakland County increased to $316,000, up by 5.3% over last October, based on 1,385 sales. Listings spent an average of 30 days on the market, up 5 days compared to last October.
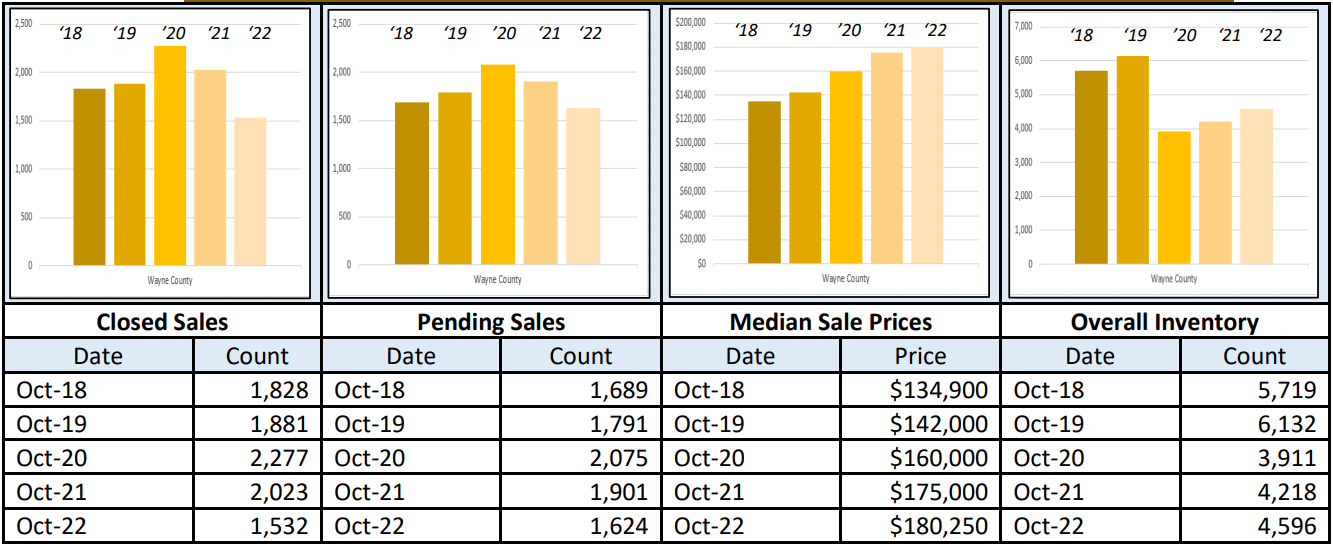
The Median Sale Price for Wayne County increased to $180,250, up by 3% over last October, based on 1,532 sales. Listings spent an average of 29 days on the market, up 4 days compared to last October.
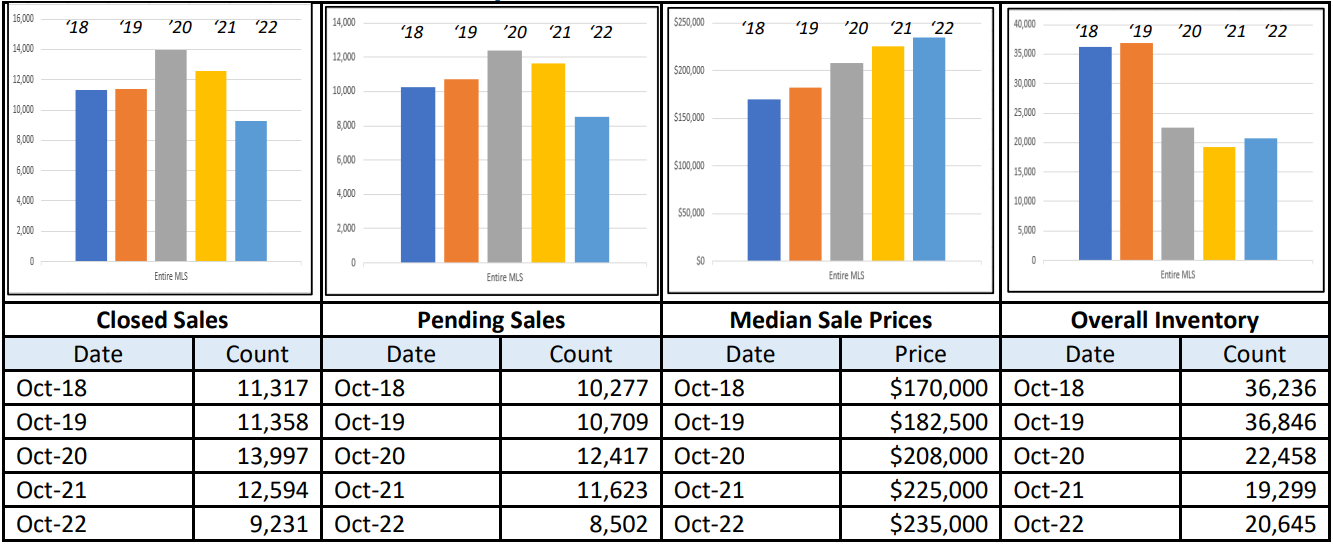
October 5-Year Perspectives -- Residential & Condos Combined -- All MLS
October 5-Year Perspectives -- Residential & Condos Combined -- Livingston County
October 5-Year Perspectives -- Residential & Condos Combined -- Macomb County Numbers
October 5-Year Perspectives -- Residential & Condos Combined -- Oakland County Numbers
October 5-Year Perspectives -- Residential & Condos Combined -- Wayne County Numbers
October 5-Year Perspectives -- Residential & Condos Combined – City of Detroit Numbers
It’s important to note that these numbers present a high level view of what is happening in the real estate market in the lower part of Michigan and in specific regions. Be sure to contact a REALTOR® for their expertise about local markets.
Realcomp Shareholder Boards & Associations of REALTORS®:
- DABOR, 313-278-2220
- DAR, Sharon Armour, EVP, 313-962-1313
- ETAR, Laura VanHouteghen, 810-982-6889
- GMAR, Vickey Livernois, EVP, 248-478-1700
- GPBR, Bob Taylor, CEO, 313-882-8000
- LUTAR, 810-664-0271
- LCAR, Pam Leach, EVP, 810-225-1100
- NOCBOR, Patricia Jacobs, EVP, 248-674-4080