
National Real Estate Commentary
U.S. existing-home sales slipped 1.0% month-over-month and were down 6.2% year-over-year as of last measure, while pending sales jumped 8.3% from the previous month, marking the largest gain since June 2020, according to the National Association of REALTORS® (NAR). Mortgage rates have dropped significantly from their peak last fall, and homebuyers are beginning to come out of the woodwork, with NAR forecasting a 13% increase in existing-home sales this year compared to 2023.
Despite tepid sales activity, the persistent shortage of housing supply has helped prop up home values nationwide, with the median existing-home price rising 4.4% year-over-year to $382,600, according to NAR. Total unsold inventory was at 1 million units heading into February, an 11.5% decline from the previous month, for a 3.2 months’ supply at the current sales pace.
Nationally, listing activity has started to pick up, and with mortgage rates stabilizing and housing completions on the rise, inventory is expected to improve in the coming months.
January-Local Activity
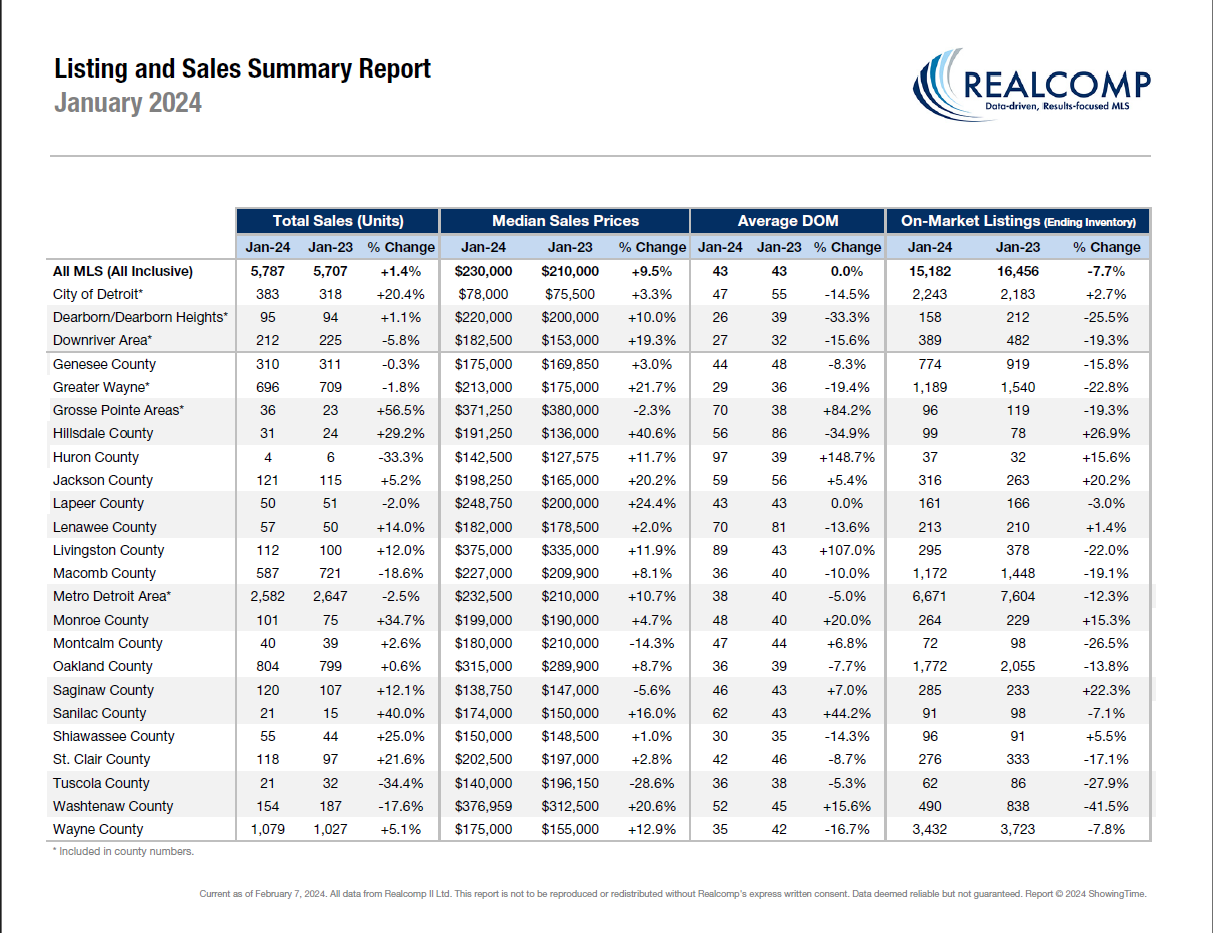
Closed Sales increased 1.5 percent for Residential homes and 1.0 percent for Condo homes. Pending Sales decreased 11.9 percent for Residential homes and 1.4 percent for Condo homes. Inventory decreased 9.0 percent for Residential homes but increased 0.6 percent for Condo homes.
The Median Sales Price increased 9.5 percent to $229,900 for Residential homes and 11.9 percent to $235,000 for Condo homes. Days on Market were dead even with last year for both property types. Months Supply of Inventory remained flat for Residential homes but increased 5.6 percent for Condo homes.
“Momentum in the city of Detroit continued in January with signs of more good things to come in the days ahead,” said Karen S. Kage, CEO of Realcomp. “At the same time, median sales prices across the entire MLS rose nearly another 10% year over year, which we hope will motivate more potential home sellers to add to the inventory pool.”
January Y-O-Y Comparison -- Residential & Condos Combined -- All MLS
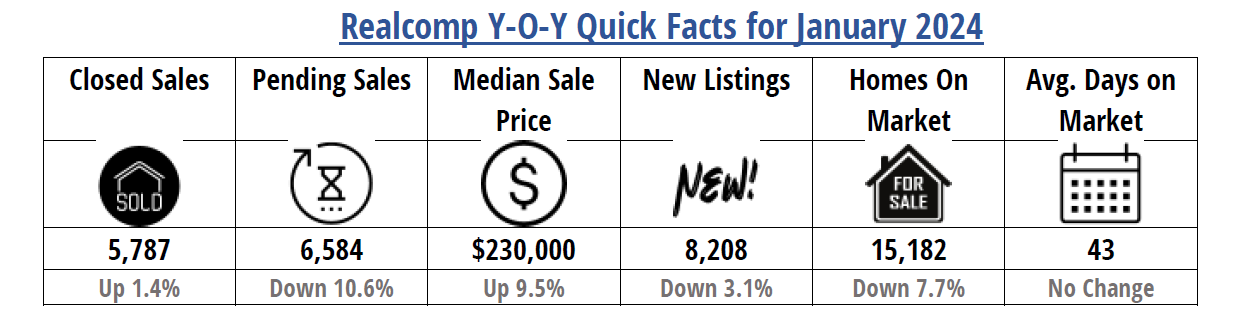
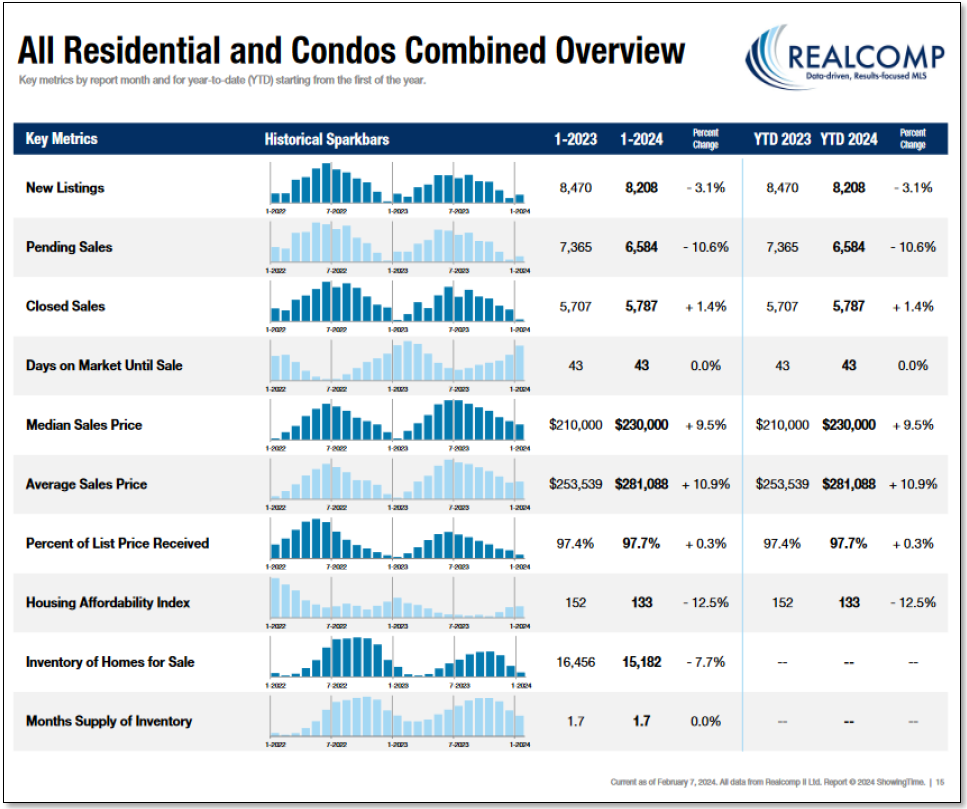
- New Listings decreased by 3.1% from 8,470 to 8,208.
- Pending Sales decreased by 10.6% from 7,365 to 6,584.
- Closed Sales increased by 1.4% from 5,707 to 5,787.
- Average days on Market (DOM) stayed the same at 43 days.
- Median Sale Price increased by 9.5% from $210,000 to $230,000.
- Percentage of last list price received increased slightly by .3% from 97.4% to 97.7%.
- Inventory of Homes for Sale decreased by 7.7% from 16,456 to 15,182.
- Months-Supply of Inventory held at 1.7.
- Average Showings per Home decreased slightly from 9.0 to 8.4.
- Listings that were both listed and pended in the same month were at 2,710. This represents 33.0% of the new listings for the month and 41.2 of the pended listings.
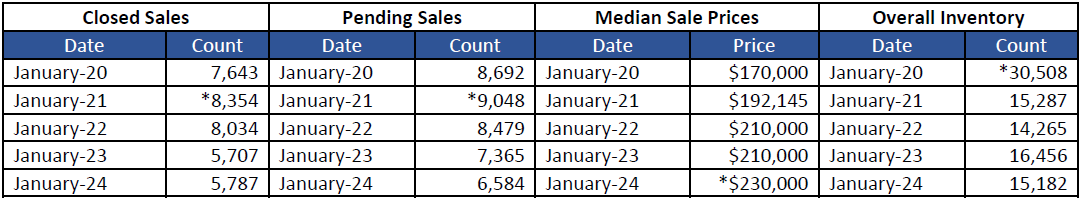
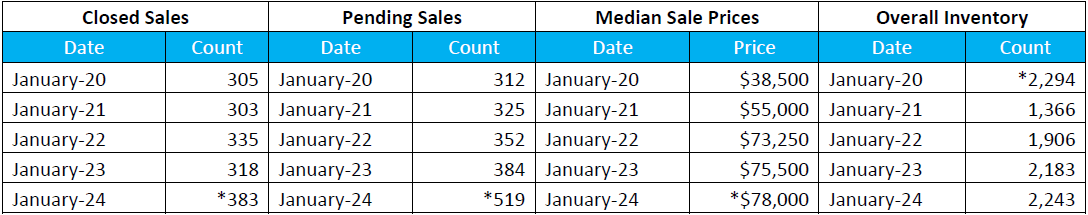
January 5-Year Perspectives -- Residential & Condos Combined -- All MLS
January 5-Year Perspectives -- Residential & Condos Combined – City of Detroit Numbers
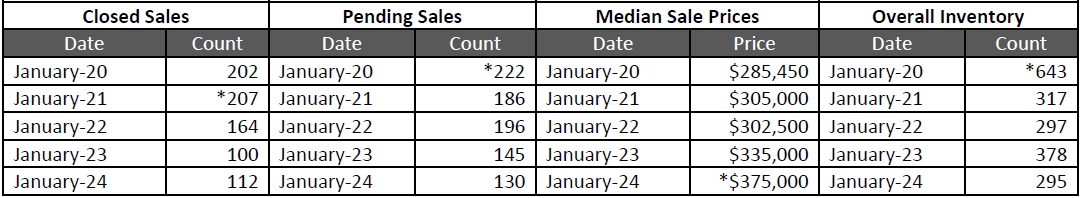
January 5-Year Perspectives -- Residential & Condos Combined -- Livingston County
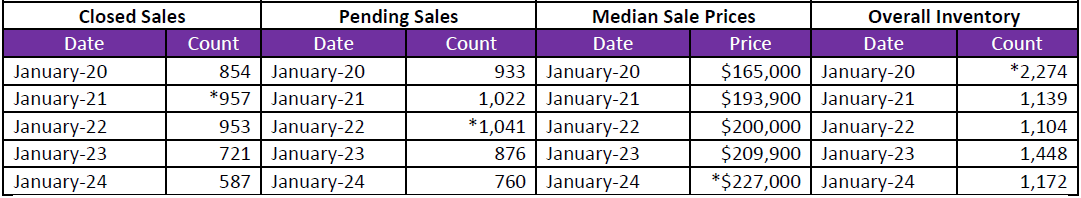
January 5-Year Perspectives -- Residential & Condos Combined -- Macomb County Numbers
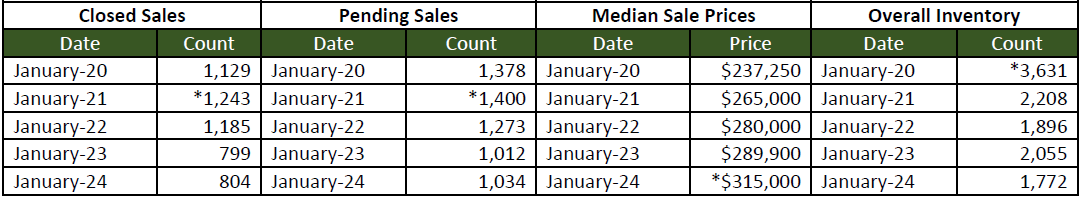
January 5-Year Perspectives -- Residential & Condos Combined -- Oakland County Numbers
January 5-Year Perspectives -- Residential & Condos Combined -- Wayne County Numbers
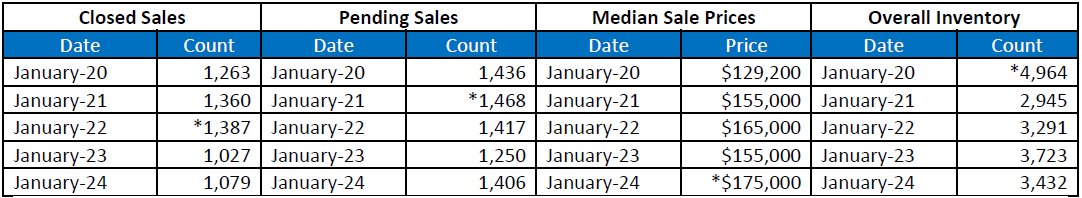
*high points noted with an asterisk.
Note: These numbers represent real estate market activity in the lower part of Michigan. Be sure to contact a REALTOR® for their expertise about local markets. Find a REALTOR® in your market at www.MoveInMichigan.com.
Realcomp Shareholder Boards & Associations of REALTORS®:
- DABOR, Andrea Kuentz, Interim CEO, 313-278-2220
- DAR, Sharon Armour, EVP, 313-962-1313
- ETAR, Laura VanHouteghen, 810-982-6889
- GPBR, Bob Taylor, CEO, 313-882-8000
- LUTAR, 810-664-0271
- LCAR, Pam Leach, EVP, 810-225-1100
- NOCBOR, Patricia Jacobs, EVP, 248-674-4080