Realcomp has enhanced its InfoSparks program (created by ShowingTime) to include a new add-on module called MarketViewMLS. MarketView MLS equips agents, offices, and firms with the ability to generate performance statistics in report and chart form based on trusted MLS data.
MarketView MLS Features Include:
-
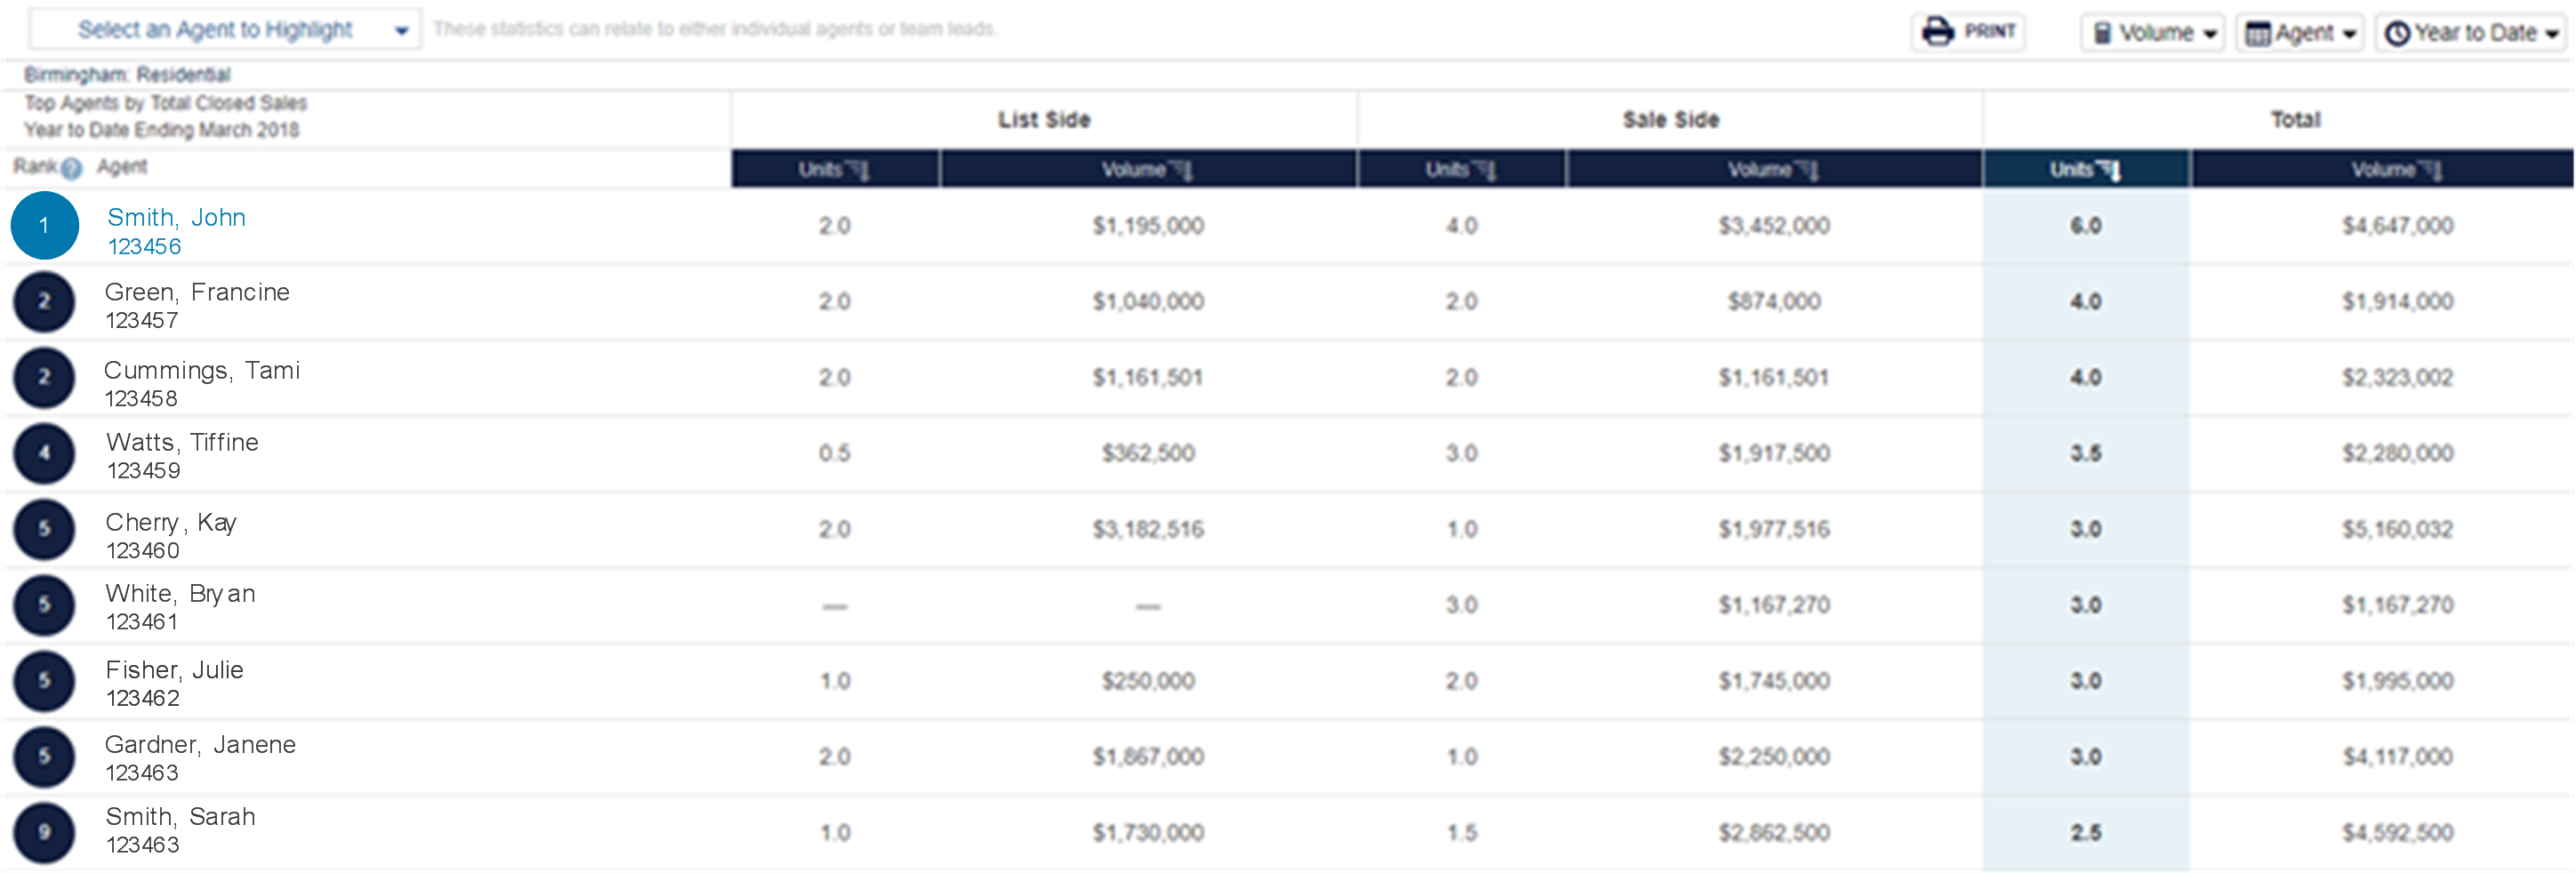
Ranking - Rank agents, offices, and firms by units or dollar volume for list side, sale side, or total sides.
- The top 100 will be displayed based on the selections made. Choose “Select an Agent to Highlight” to search the complete list.
- By default, rankings are sorted by Total and Volume of closed transactions. Selecting a different column header sorts the rankings based on that column.
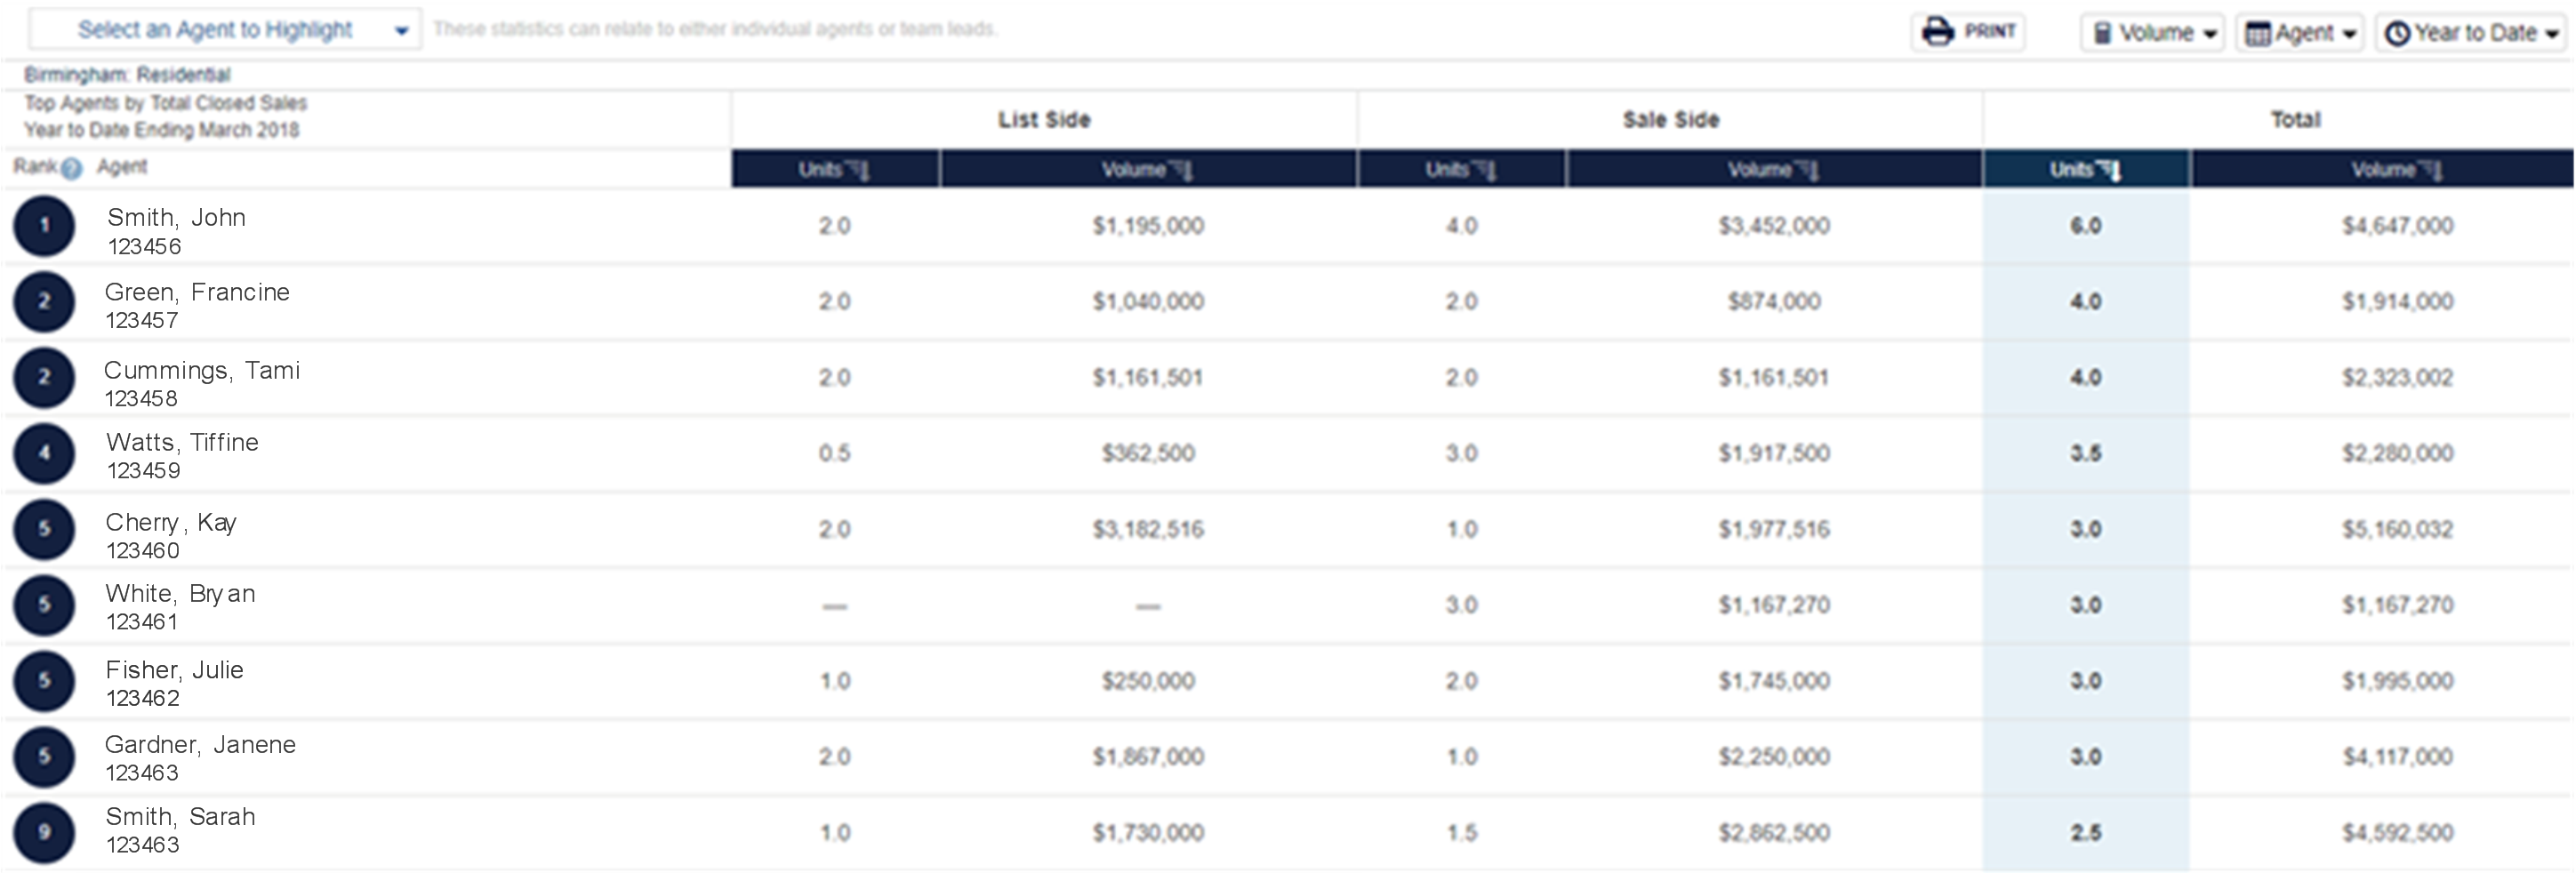
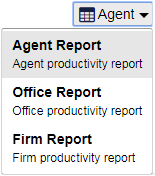
- Report Type options include Agent Report, Office Report, and Firm Report.
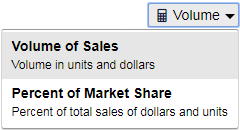
- Report measures include volume in units and dollars or as a percent of market share.
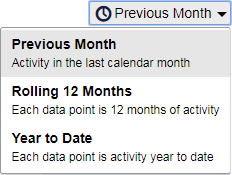
- Time calculations include Previous Month, Rolling 12 Months, and Year to Date.
-
Highlighting - Highlight an agent, office, or firm to compare performance to a ranked list
Use InfoSparks and MarketView to generate data that supports your recommendations and credentials during listing presentations. Compare local numbers to regional numbers and numbers for yourself and/or your company to the market at large.
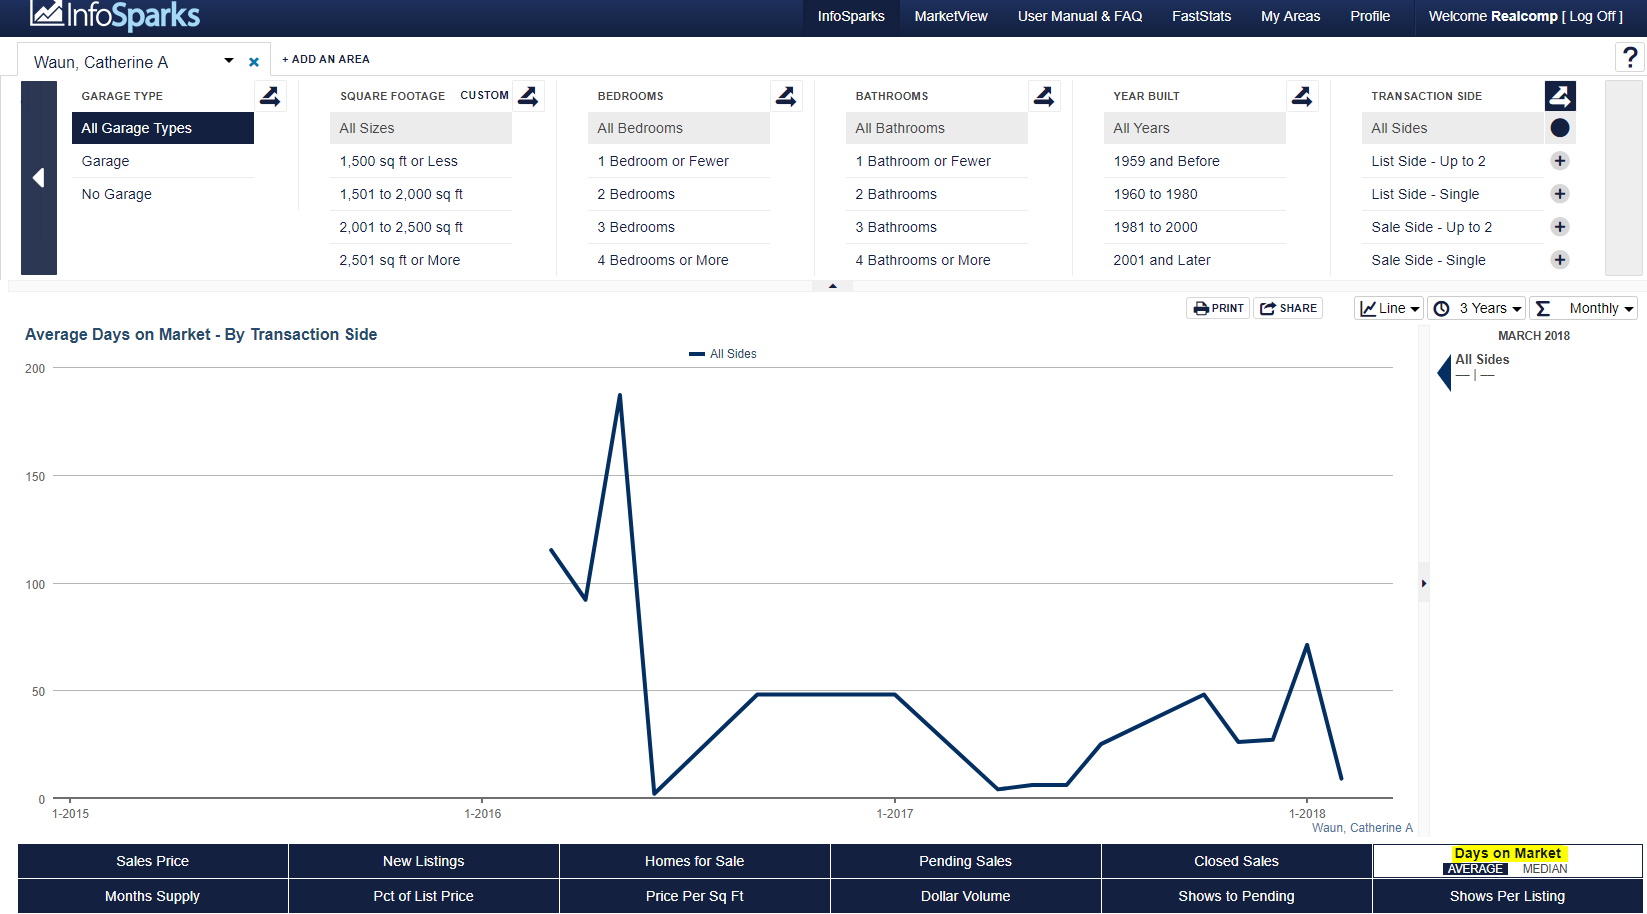
An example of this could include reviewing your average Days on Market (DOM) for closed transactions and comparing that to the Average DOM for closed transactions in the MLS to be able to say to sellers, “The average DOM for listings sold in the region is 70 days, but my average is 65 days. On average, I save my sellers five days.”
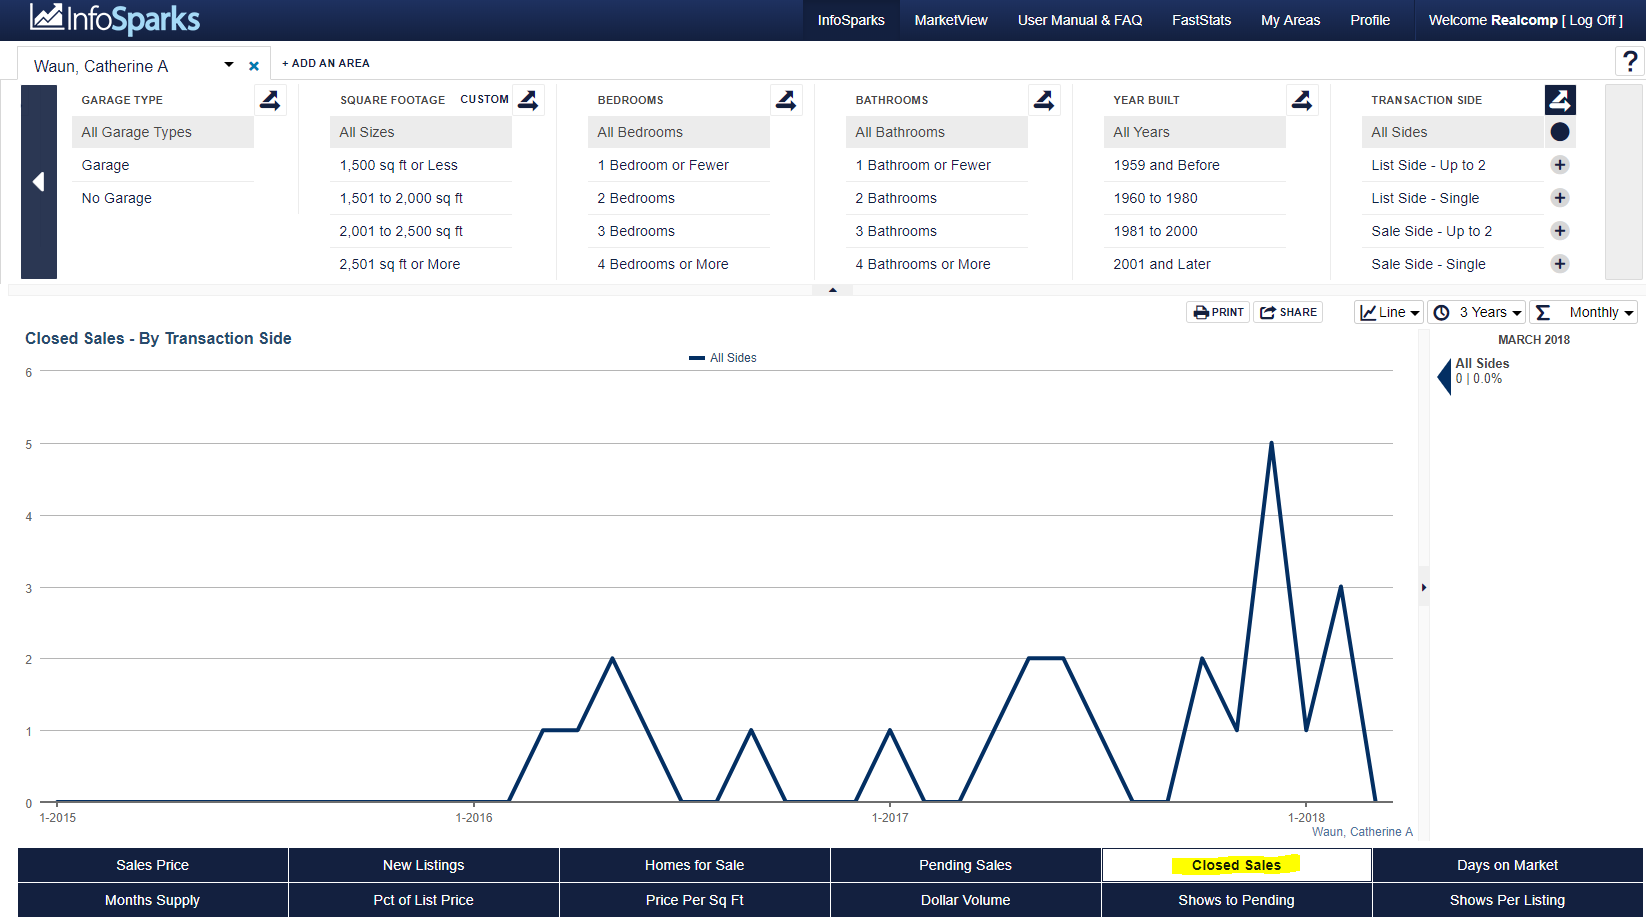
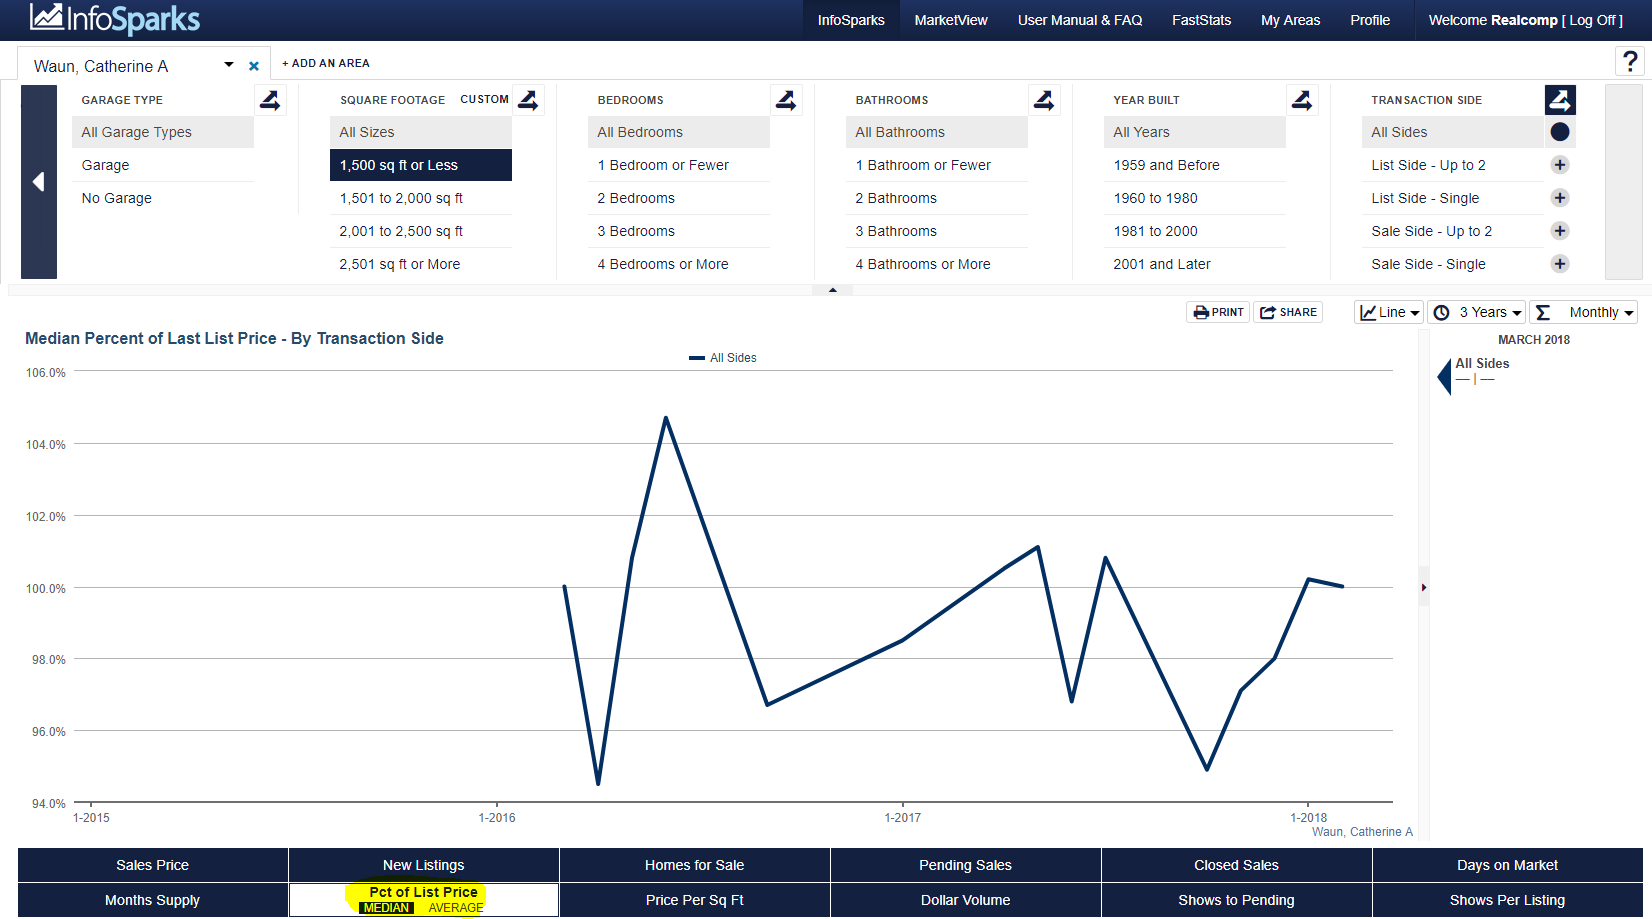
Data can be filtered in many different ways by using geographical and housing characteristics to enable you to chart the metrics you desire.
New InfoSparks Filters Include:
Agents, Offices, and Firms Added to Area Choices: In addition to the previous area (i.e. All, County, Postal Code, School District, and Area) choices, you can now search by Agents, Offices, or Firms (shown at right). You may add up to four area tabs for comparison. The default area is the Entire MLS.
Transaction Side Added to Filters: You also have the option of pulling metrics based on transaction sides (shown at right). The default is all sides.
- List Side – Up to 2 allows you to pull metrics on listings serviced by a listing agent or a listing and co-listing agent (all instances).
- List Side – Single allows you to pull metrics on listings serviced by a single list agent.
- Sale Side – Up to 2 allows you to pull metrics on listings sold by a selling agent or a selling and co-selling agent (all instances).
- List Side – Single allows you to pull metrics on listings sold by a single selling agent.
Report Types: Many new report options are available to MLS subscribers now that the above filters have been added to InfoSparks. Examples of reports you may want to run for your listing presentations include:
Closed Sales
Days on Market
List Price
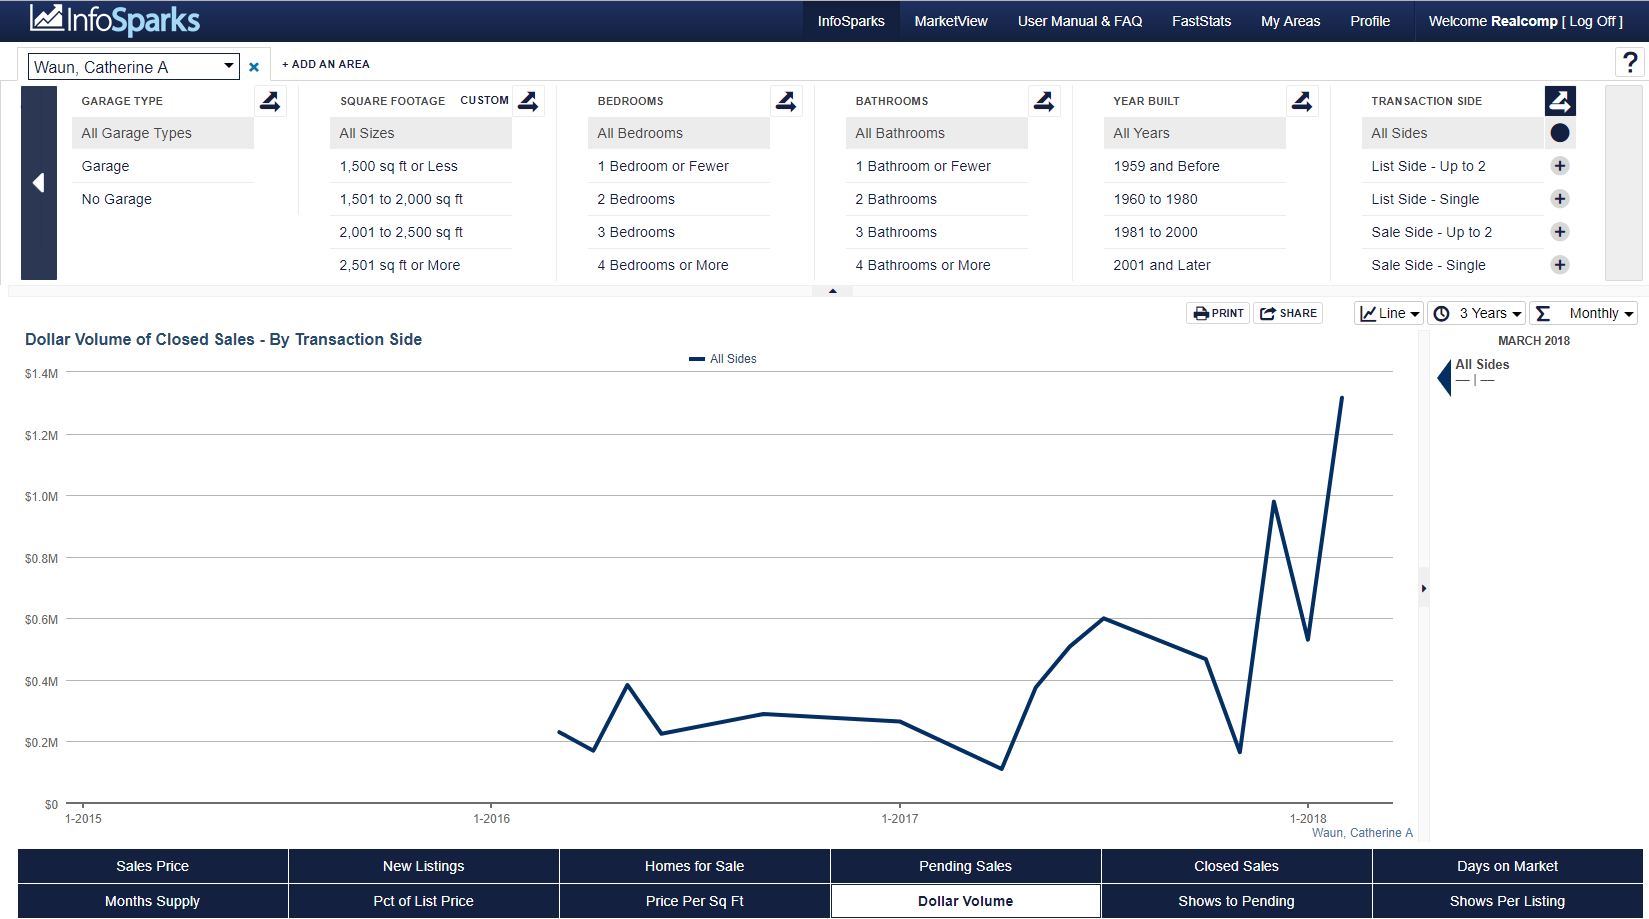
Dollar Volume
Shows to Pending
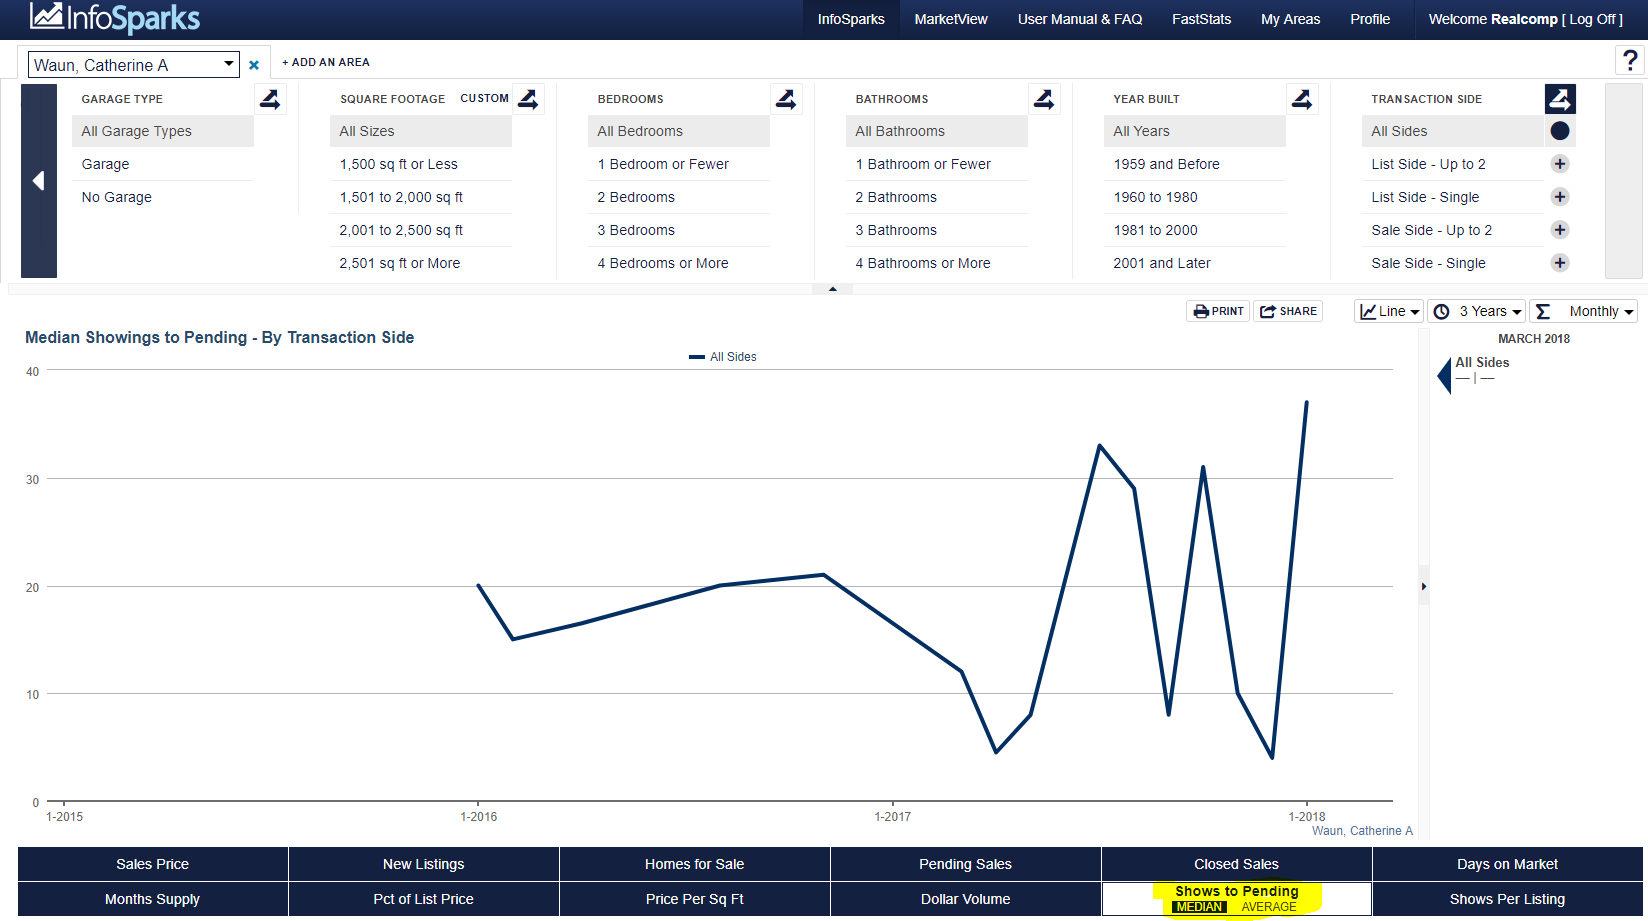
Run them for the entire MLS area, a county, or an applicable CVT. Then run the numbers based on your personal production, that of your office, and/or that of your firm.
Compare the reports and determine which ones you’ll take to your next client meeting!
InfoSparks and MarketView MLS are interactive market analytics tools for MLSs that equip subscribers with relevant market data. Realcomp provides both of these tools to our MLS subscribers.
Last Modified: Wednesday, September 14, 2022