Realcomp is excited to announce the availability of a new report for Designated REALTORS®/Broker Owners. The report is automatically e-mailed to the Broker for the previous month and summarizes the following for the office(s)/firm:
Charts and Graphs Depicting:
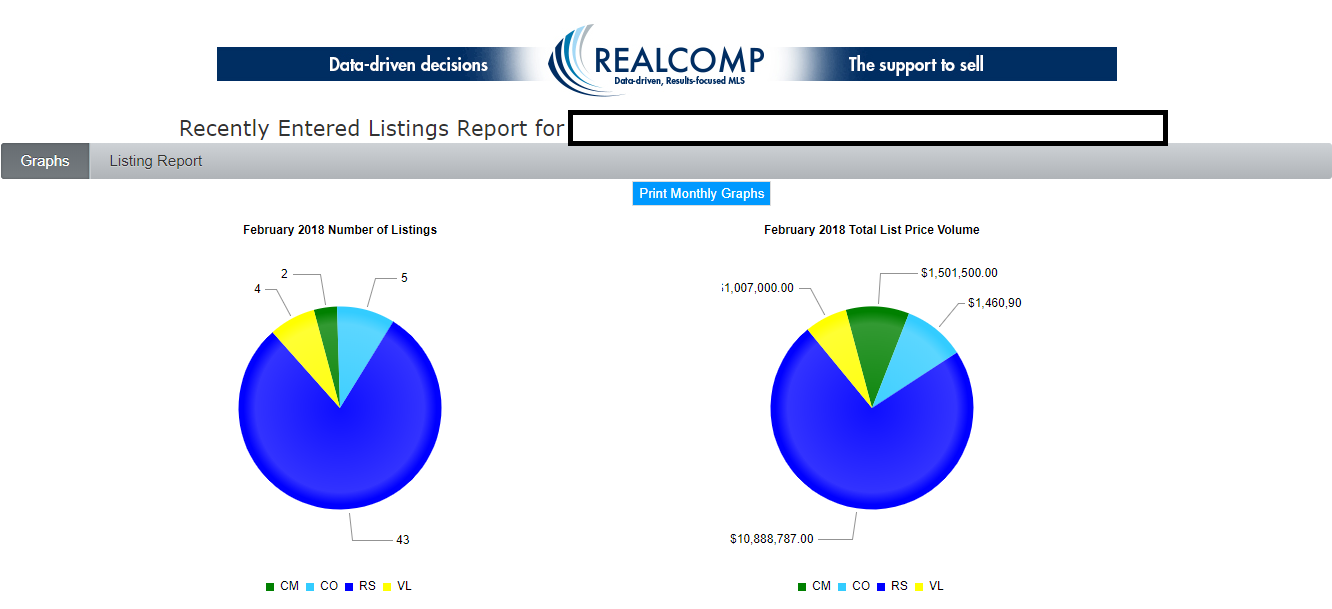
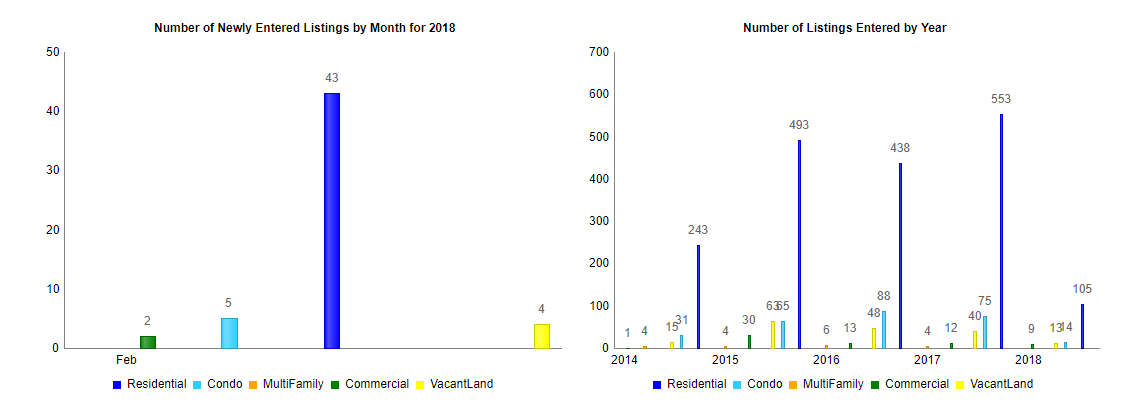
- Number of New Listings per Property Category
- Total List Price Volume per Property Category
- Number of Listings Entered by Year per Property Category
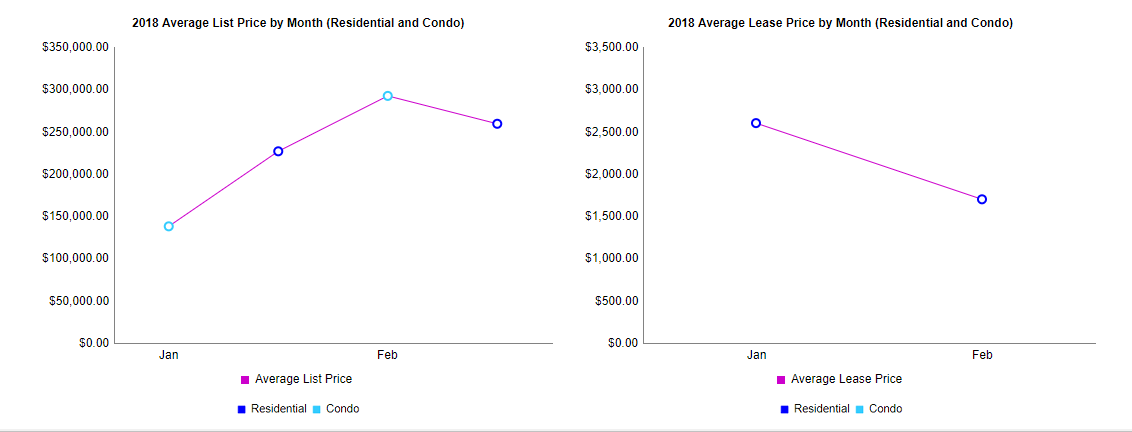
- Average List Price by Month for Single-Family Homes
- Average Lease Price by Month for Single-Family Homes

(Graph 1 of 3)

(Graph 2 of 3)

(Graph 3 of 3)
One-Line Report for Newly Entered Listings Displaying:
- MLS Number
- Property Type
- Transaction Type
- Address
- Status
|
- List Price
- Sale Price
- DOM
- List Agent
- Entry Date
|
These reports provide the Broker with a quick and handy way to review listing activity for the previous month and determine potential revenue based on just that month’s new listing inventory.
It’s also a quick way to review all of the properties that have had a status change since the listing was entered, and those that remain ACTV.
Thoughts about the report? Please let us know! Please provide your feedback to us at support@corp.realcomp.com
Last Modified: Tuesday, March 27, 2018