A MONTH OF ALL-TIME HIGHS FOR MEDIAN SALES PRICES ACROSS ENTIRE MLS*
June – National Real Estate Commentary
Rising inflation, soaring home prices, and increased mortgage interest rates have combined to cause a slowdown in the U.S. housing market. To help quell inflation, which reached 8.6% as of last measure in May, the Federal Reserve raised interest rates by three quarters of a percentage point in June, the largest interest rate hike since 1994. Higher prices, coupled with 30-year fixed mortgage rates approaching 6%, have exacerbated affordability challenges and rapidly cooled demand, with home sales and mortgage applications falling sharply from a year ago.
With monthly mortgage payments up more than 50% compared to this time last year, the rising costs of homeownership have sidelined many prospective buyers. Nationally, the median sales price of existing homes recently exceeded $400,000 for the first time ever, a 15% increase from the same period a year ago, according to the National Association of REALTORS®. As existing home sales continue to soften nationwide, housing supply is slowly improving, with inventory up for the second straight month. In time, price growth is expected to moderate as supply grows; for now, however, inventory remains low, and buyers are feeling the squeeze of higher prices all around.
June – Activity by Region or County – A Month of Firsts
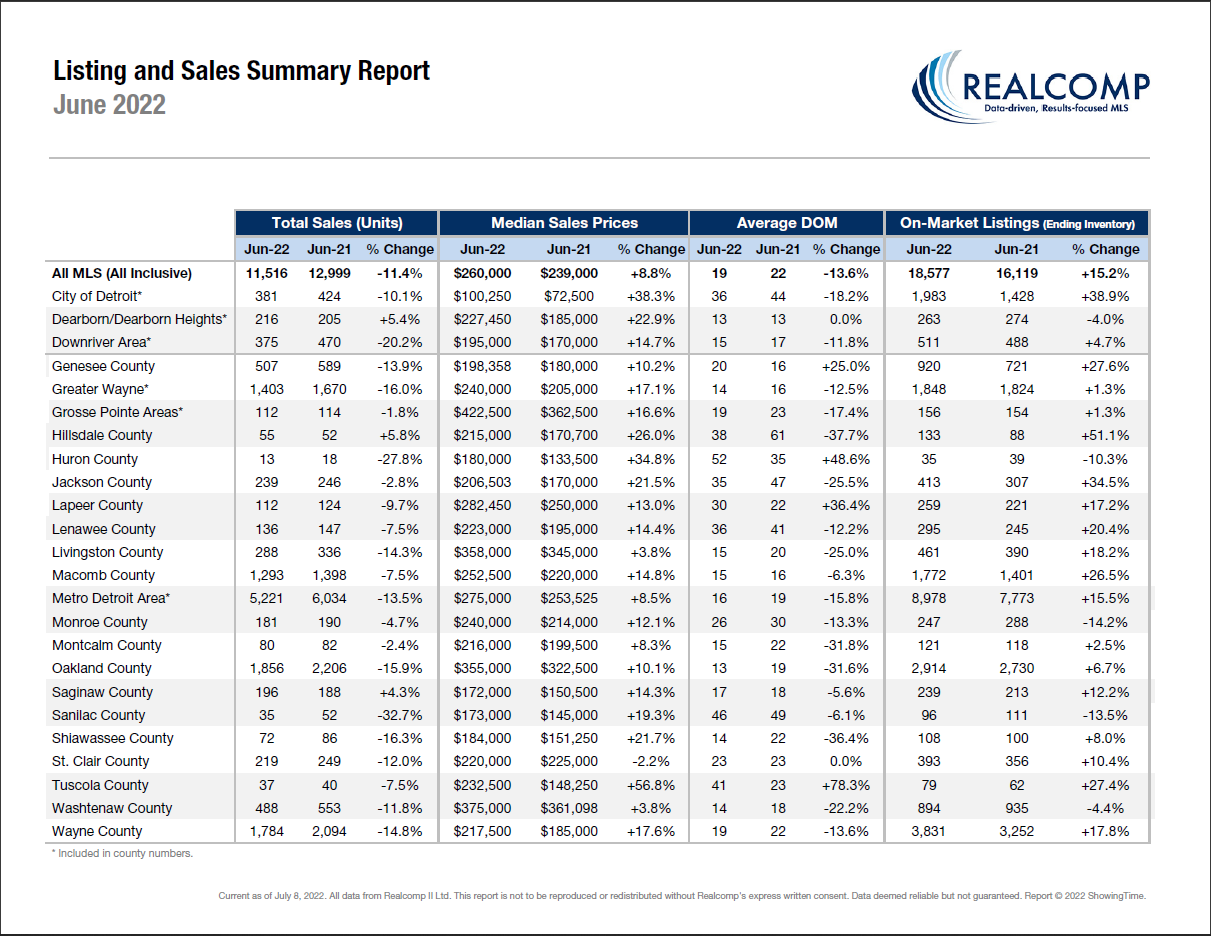
The Median Sale Price for the Metro Detroit area (Livingston, Macomb, Oakland, & Wayne combined)reached an all-time high at $275,000, up by 8.5% over last June, based on 5,221 sales. Listings spent an average of 16 days on the market, down 3 days compared to last June.
The Median Sale Price for the City of Detroit surpassed the $100K threshold for the first time at $100,250, up by 38.3% over last June, based on 381 sales. Listings spent an average of 36 days on the market, down 8 days compared to last June.
The Median Sale Price for Lapeer County surpassed the $280K threshold for the first time at $282,450, up by 13% over last June, based on 112 sales. Listings spent an average of 30 days on the market, up 8 days compared to last June.
The Median Sale Price for Livingston County rose to $358,000, up by 3.8% over last June, based on 288 sales. Listings spent an average of 15 days on the market, up 5 days compared to last June. *The Livingston County median sale price reached an all-time high of $379,900 in May of this year.*
The Median Sale Price for Macomb County surpassed the $250K threshold for the first time at $252,500, up by 14.8% over last June, based on 1,293 sales. Listings spent an average of 15 days on the market, down 1 day compared to last June.
The Median Sale Price for Oakland County surpassed the $350K threshold for the first time at $355,000, up by 10.1% over last June, based on 1,856 sales. Listings spent an average of 13 days on the market, down 6 days compared to last June.
The Median Sale Price for Wayne County passed the $200K threshold for the first time at $217,500, up by 17.6% over last June, based on 1,784 sales. Listings spent an average of 19 days on the market, down 3 days compared to last June.
June – All MLS Numbers – Residential & Condos Combined
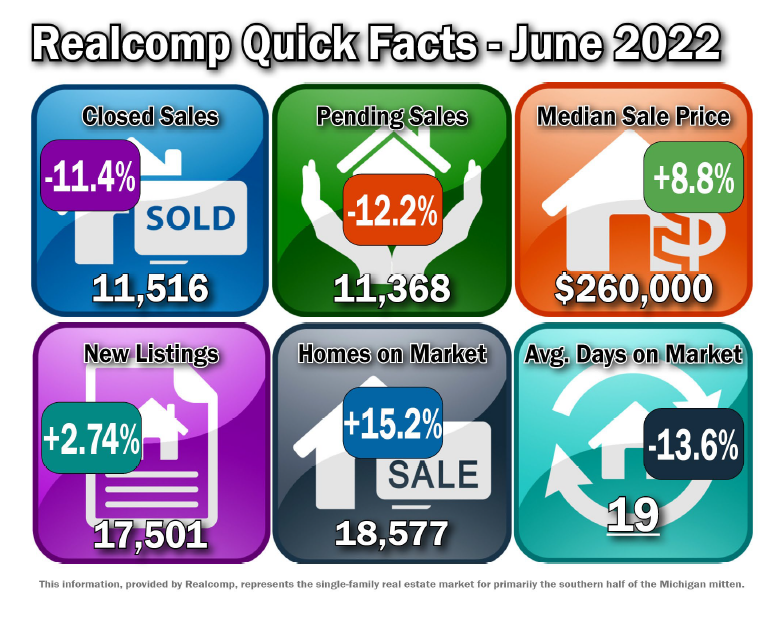
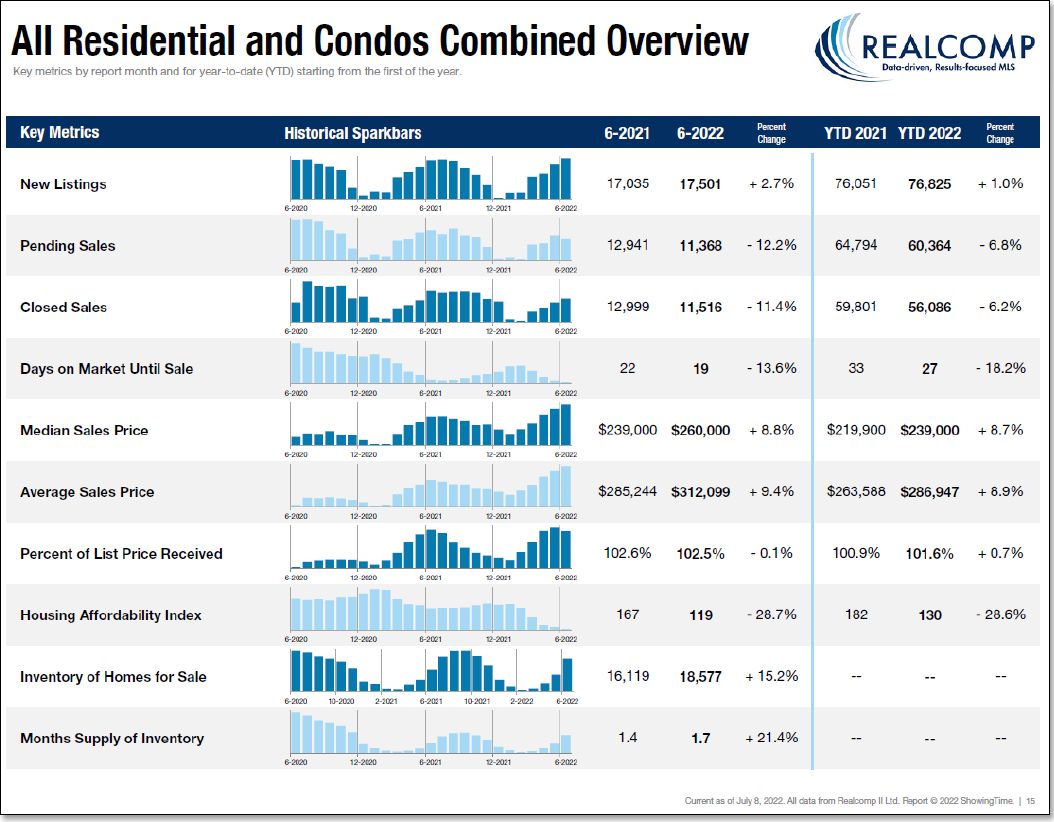
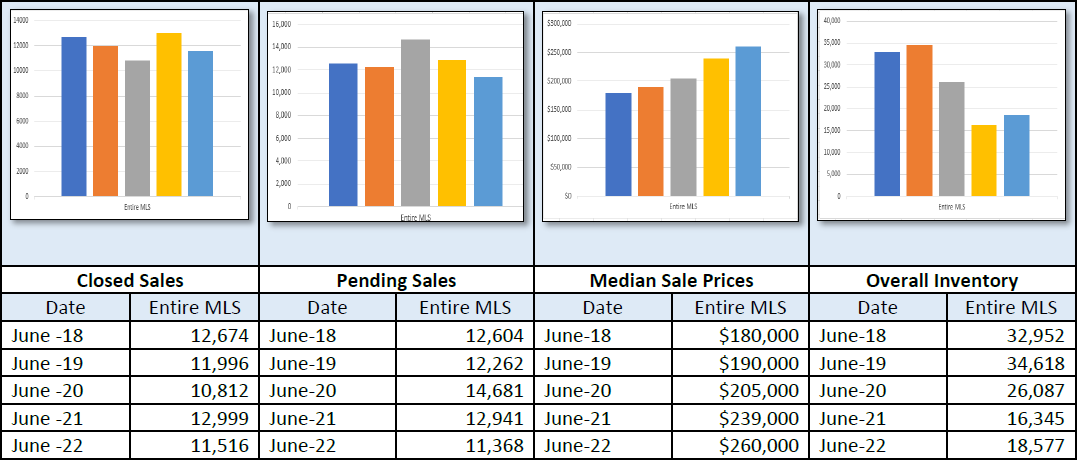
Median Sale Price increased by 8.8% from $239,000 to $260,000.
The average days on market (DOM) decreased by 13.6% from 22 to 19 days.
The average % of the last list price received decreased by .1% from 102.6% to 102.5%.
New Listings increased by 2.7% from 17,035 to 17,501.
Average Showings per Home decreased by 4 from 13 to 9.
Pending Sales decreased by 12.2% from 12,941 to 11,368.
Closed Sales decreased by 11.4% from 12,999 to 11,516.
Listings that were both listed and pended in the same month were at 6,772. This represents 38.7% of the new listings for the month and 59.6% of the pended listings.
Months-Supply of Inventory increased by 21.4% from 1.4 to 1.7.
It’s important to note that these numbers present a high level view of what is happening in the real estate market in the lower part of Michigan and in specific regions. Be sure to contact a REALTOR® for their expertise about local markets.
Realcomp Shareholder Boards & Associations of REALTORS®:
- DABOR, 313-278-2220
- DAR, Sharon Armour, EVP, 313-962-1313
- ETAR, Laura VanHouteghen, 8010-982-6889
- GMAR, Vickey Livernois, EVP, 248-478-1700
- GPBR, Bob Taylor, CEO, 313-882-8000
- LUTAR, 810-664-0271
- LCAR, Pam Leach, EVP, 810-225-1100
- NOCBOR, Patricia Jacobs, EVP, 248-674-4080