Home Prices Remain Strong, Consistent in 2023
Market Forces Continue to Dictate Activity
January – National and Local Real Estate Commentary
The US housing market began the year in a state of rebalance, with many buyers and sellers remaining cautious while they wait to see where the market is headed. Nationally, pending sales rose 2.5% month-to-month, marking the first increase since May, while sales of existing homes fell 1.5% as of last measure, according to the National Association of Realtors® (NAR). Demand for housing persists, but higher mortgage interest rates have cut into housing affordability, with total home sales down 17.8% last year compared to 2021. Locally, Closed Sales decreased 29.0 percent for Residential homes and 34.6 percent for Condo homes. Pending Sales decreased 12.5 percent for Residential homes and 22.0 percent for Condo homes. Inventory increased 15.8 percent for Residential homes and 13.0 percent for Condo homes.
The Median Sales Price increased 1.0 percent to $210,000 for Residential homes but decreased 5.2 percent to $208,625 for Condo homes. Days on Market increased 19.4 percent for Residential homes and 16.7 percent for Condo homes. Months-Supply of Inventory increased 33.3 percent for Residential homes and 30.8 percent for Condo homes.
“Market factors continue to set the tone,” said Karen Kage, CEO, Realcomp II Ltd. “And, while some potential home buyers are taking a wait and see approach, others previously deterred by competition appear to be dipping their toes in.”
As sales slow, time on market is increasing, with the average home spending 26 days on market as of last measure, according to NAR. Seller concessions have made a comeback, giving buyers more time and negotiating power when shopping for a home. Although home prices remain high, mortgage rates declined steadily throughout January, falling to their lowest level since September, sparking a recent surge in mortgage demand. Lower rates should aid in affordability and may soon lead to an uptick in market activity ahead of the spring selling season..
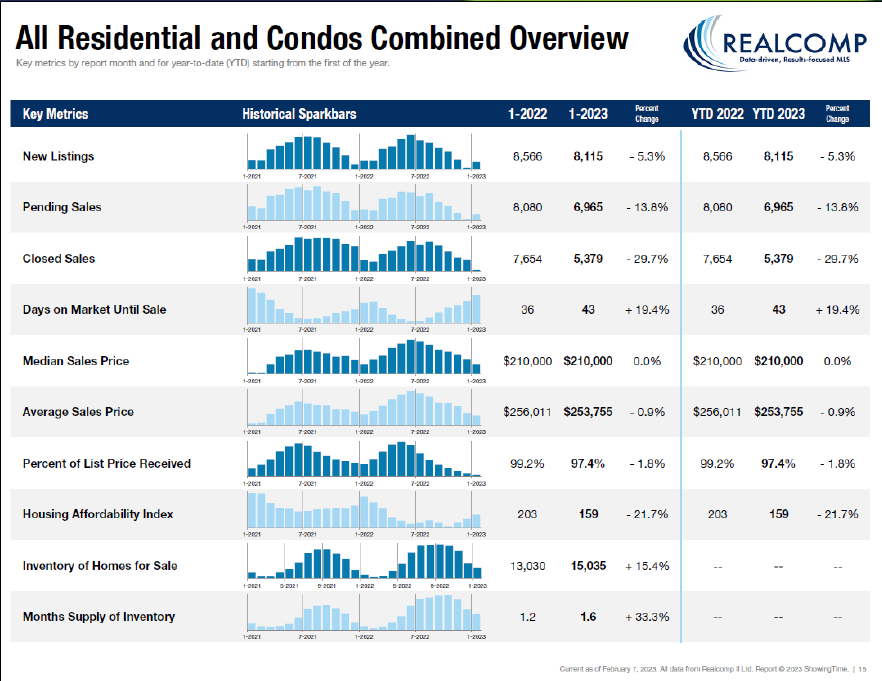
January Y-O-Y Comparison -- Residential & Condos Combined -- All MLS
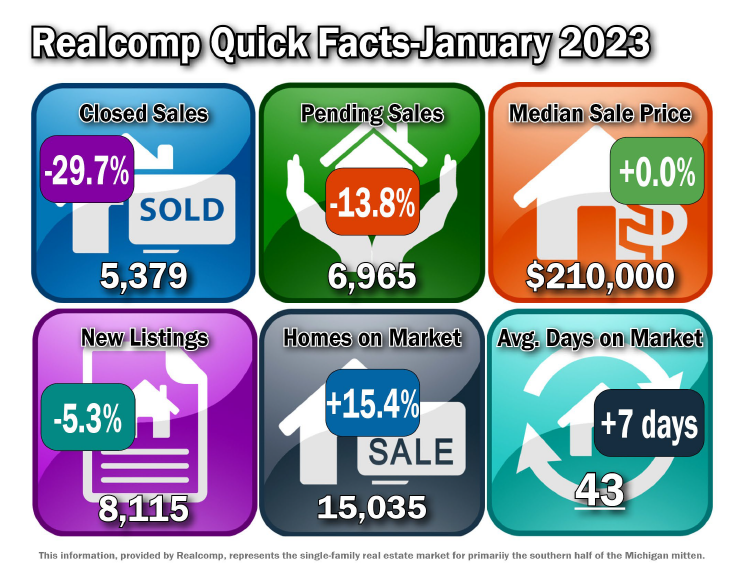
- New Listings decreased by 5.3% from 8,566 to 8,115.
- Pending Sales decreased by 13.8% from 8,080 to 6,965.
- Closed Sales decreased by 29.7% from 7,654 to 5,379.
- Average days on market (DOM) increased by 7 days from 36 to 43.
- Median Sales Price stayed the same at $210,000.
- Percent of last list price received decreased by 1.8% from 99.2% to 97.4%.
- Inventory of Homes for Sale increased by 15.4% from 13,030 to 15,035.
- Months-Supply of Inventory increased by 33.3% from 1.2 to 1.6.
- Average Showings per Home decreased by 4.3 from 13.3 to 9.
- Listings that were both listed and pended in the same month were at 2,871. This represents 35.4% of the new listings for the month and 41.2% of the pended listings.
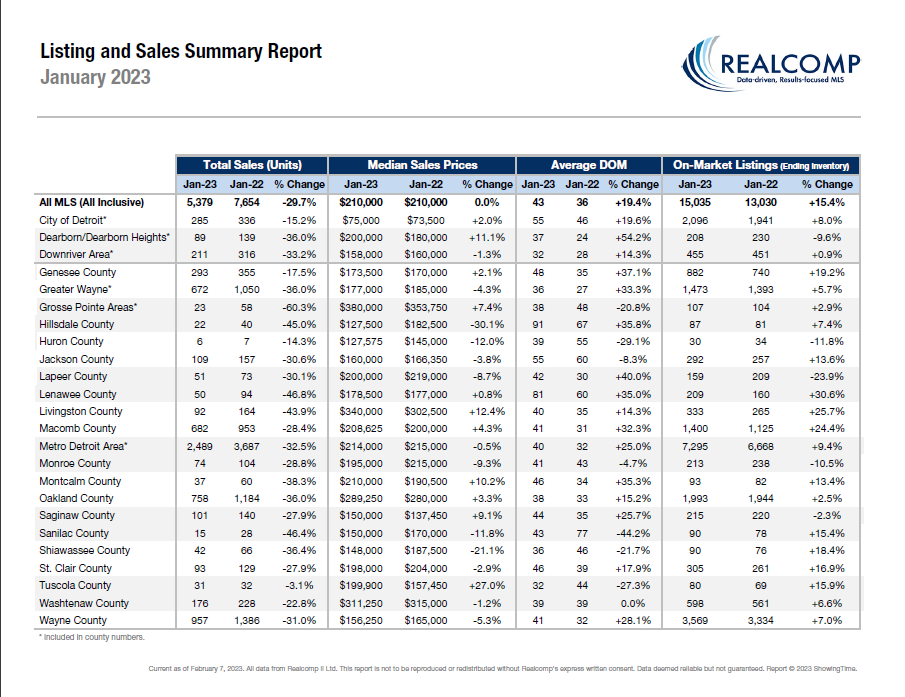
January – Activity by Region or County
- The Median Sale Price for the Metro Detroit area (Livingston, Macomb, Oakland, & Wayne combined) decreased to $214,000, down by .5% over last January, based on 2,489 sales. Listings spent an average of 40 days on the market, up 8 days compared to last January.
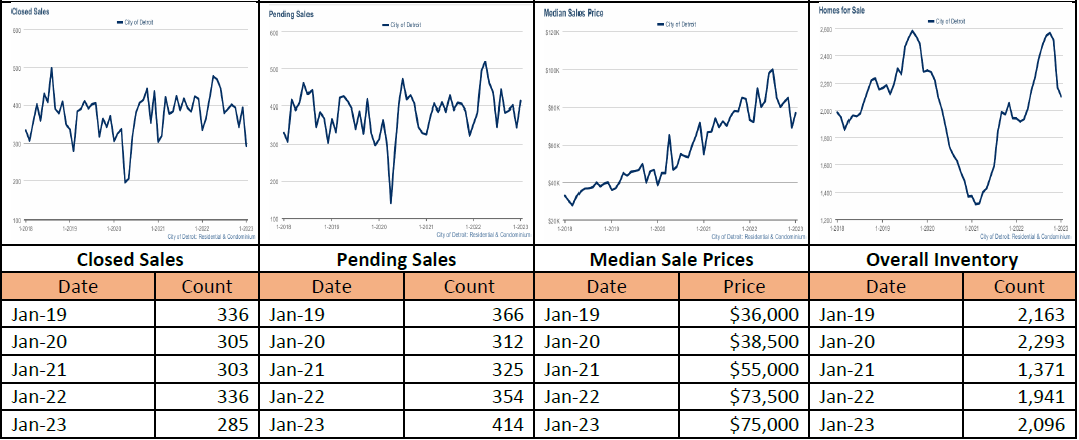
- The Median Sale Price for the City of Detroit increased to $75,000, up by 2% over last January, based on 285 sales. Listings spent an average of 55 days on the market, up by 9 days compared to last January.
- The Median Sale Price for Lapeer County decreased to $200,000, down by 8.7% over last January, based on 51 sales. Listings spent an average of 42 days on the market, up by 8 days compared to last January.
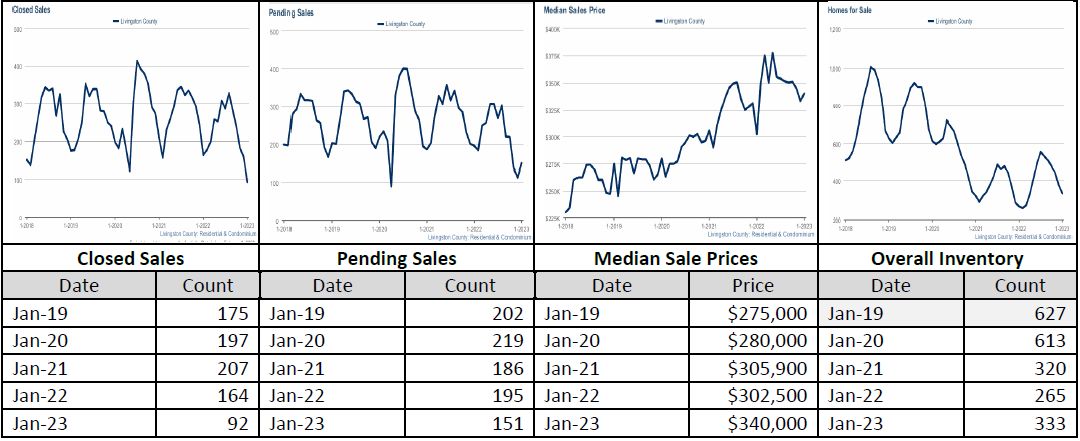
- The Median Sale Price for Livingston County increased to $340,000, up by 12.4% over last January, based on 92 sales. Listings spent an average of 40 days on the market, up by 5 days compared to last January.
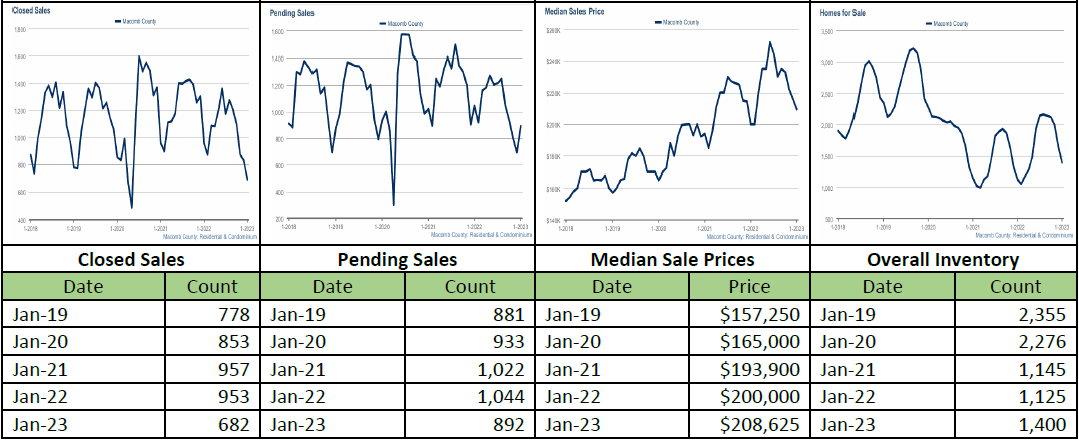
- The Median Sale Price for Macomb County increased to $208,625, up by 4.3% over last January, based on 682 sales. Listings spent an average of 41 days on the market, up by 10 days compared to last January.
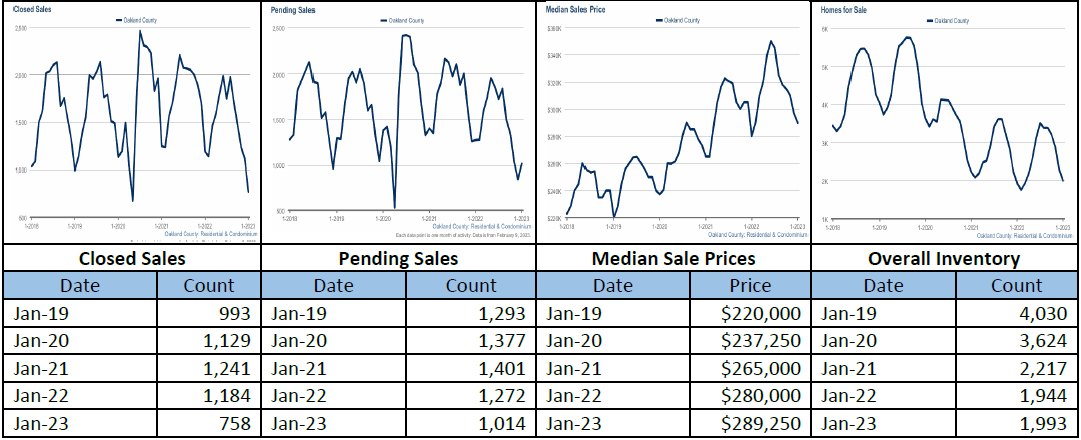
- The Median Sale Price for Oakland County increased to $289,250, up by 3.3% over last January, based on 758 sales. Listings spent an average of 38 days on the market, up by 5 days compared to last January.
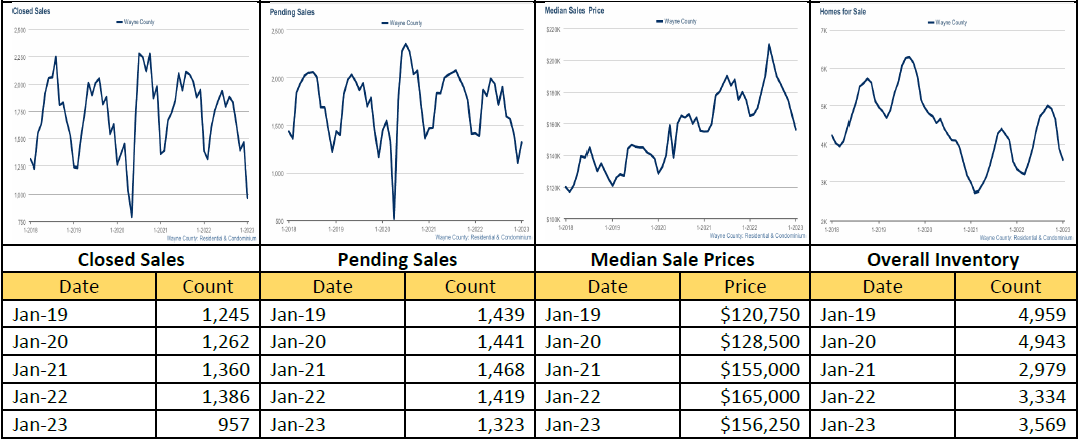
- The Median Sale Price for Wayne County decreased to $156,250, down by 5.3% over last January, based on 957 sales. Listings spent an average of 41 days on the market, up by 9 days compared to last January.
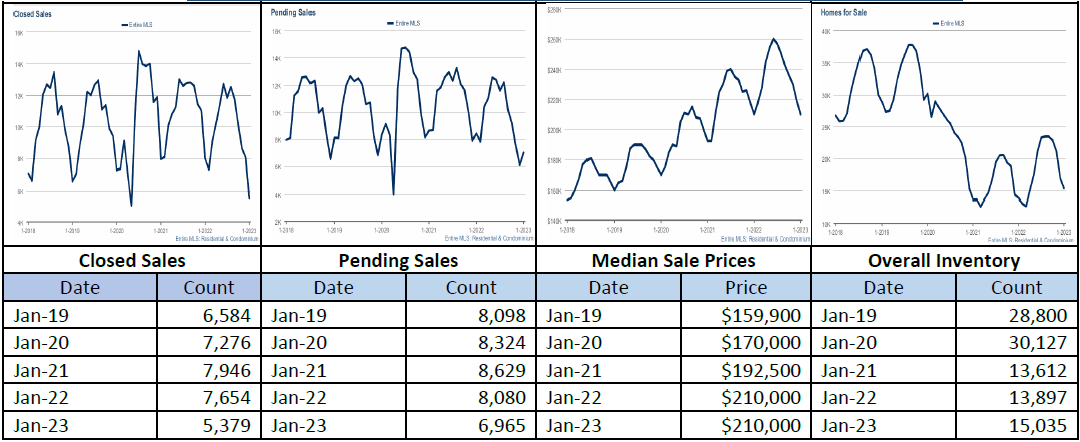
January 5-Year Perspectives -- Residential & Condos Combined -- All MLS
January 5-Year Perspectives -- Residential & Condos Combined -- Livingston County
January 5-Year Perspectives -- Residential & Condos Combined -- Macomb County Numbers
January 5-Year Perspectives -- Residential & Condos Combined -- Oakland County Numbers
January 5-Year Perspectives -- Residential & Condos Combined -- Wayne County Numbers
January 5-Year Perspectives -- Residential & Condos Combined – City of Detroit Numbers
It’s important to note that these numbers present a high-level view of what is happening in the real estate market in the lower part of Michigan and in specific regions. Be sure to contact a REALTOR® for their expertise about local markets.
Realcomp Shareholder Boards & Associations of REALTORS®:
- DABOR, Erin Richard, CEO, 313-278-2220
- DAR, Sharon Armour, EVP, 313-962-1313
- ETAR, Laura VanHouteghen, 810-982-6889
- GMAR, Vickey Livernois, EVP, 248-478-1700
- GPBR, Bob Taylor, CEO, 313-882-8000
- LUTAR, 810-664-0271
- LCAR, Pam Leach, EVP, 810-225-1100
- NOCBOR, Patricia Jacobs, EVP, 248-674-4080