Detroit Sales at 5-Year July High
with Increase in Affordability
National Real Estate Commentary
Temperatures are heating up, yet the U.S. housing market remains cooler than usual for this time of year due to a combination of low inventory and higher borrowing costs, which have restricted market activity going into the summer homebuying season. According to the latest data from the National Association of REALTORS® (NAR), national existing-home sales climbed 0.2% from the previous month but were down 20.4% compared to the same time last year, as fluctuating mortgage rates and a near all-time low level of inventory continue to influence home sales.
Nationwide, total housing inventory increased 3.8% from the previous month, for a 3-month’s supply at the current sales pace. The shortage of homes for sale has kept prices high for remaining buyers, with a national median sales price of $396,100 as of last measure, a 3.1% decline from the same time last year and the largest annual decrease since December 2011, according to NAR. As demand continues to outpace supply, properties are selling quickly, with the majority of homes listed for sale on the market for less than a month.
June-Local Activity
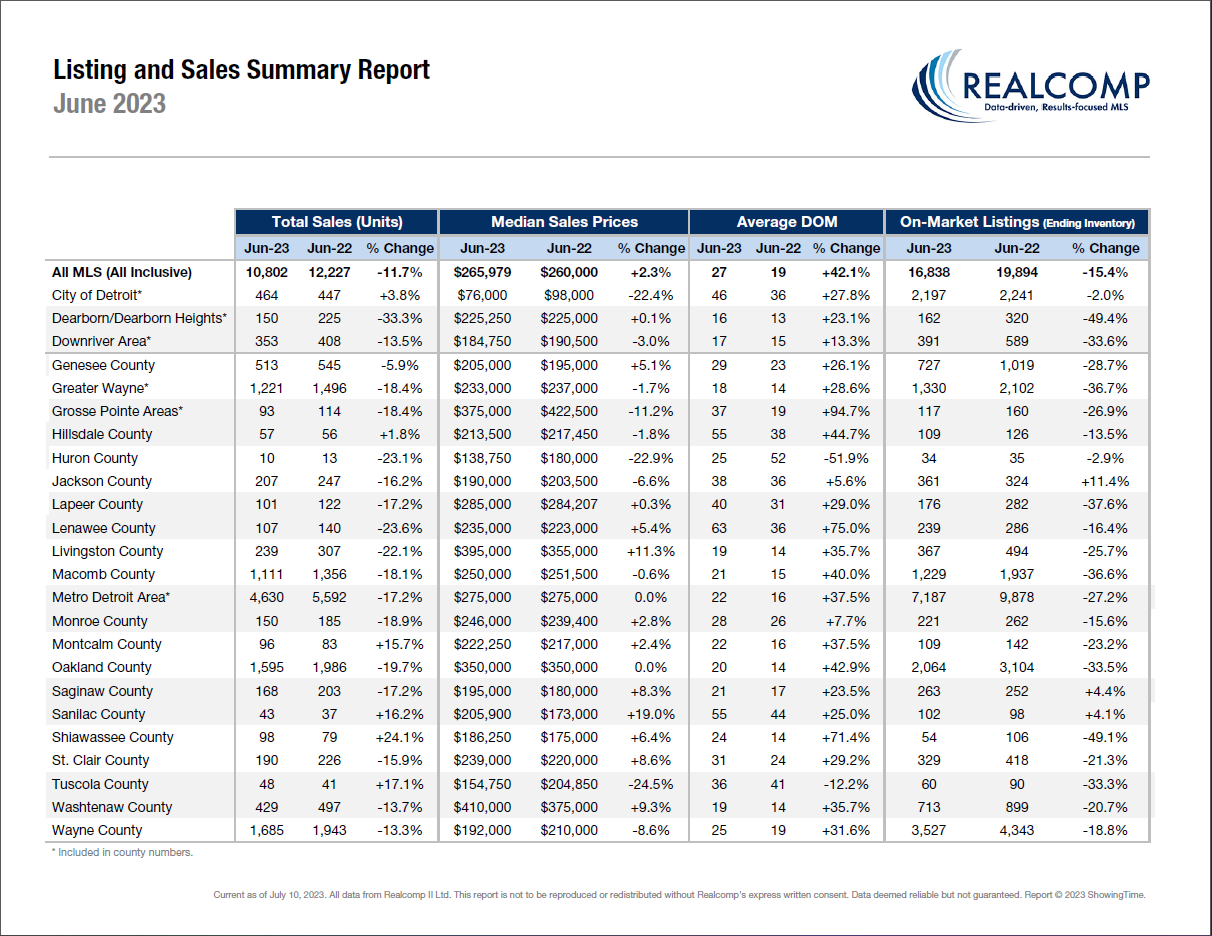
Locally, existing-home sales decreased Y-O-Y by 11.7% and total housing inventory decreased by 15.4%. Closed Sales decreased 13.0 percent for Residential homes and 1.8 percent for Condo homes. Pending Sales decreased 13.7 percent for Residential homes and 2.9 percent for Condo homes. Inventory decreased 15.5 percent for Residential homes and 14.0 percent for Condo homes.
The overall Median Sales Price increased 2.3% to $265,979. The Median Sales Price for Residential homes increased 1.9 percent to $269,900 and 4.1 percent to $255,000 for Condo homes. Days on Market increased 36.8 percent for Residential homes and 12.5 percent for Condo homes. Months-Supply of Inventory was unchanged as compared to last year for both property types.
“The marketplace is demonstrating opportunities for both buyers and sellers, especially in Detroit,” said Karen Kage, CEO, Realcomp II Ltd. “From a broader perspective, Wayne County is currently offering more inventory than Oakland and Macomb Counties combined for the 1st time in the last 18 years.”
June Y-O-Y Comparison -- Residential & Condos Combined -- All MLS
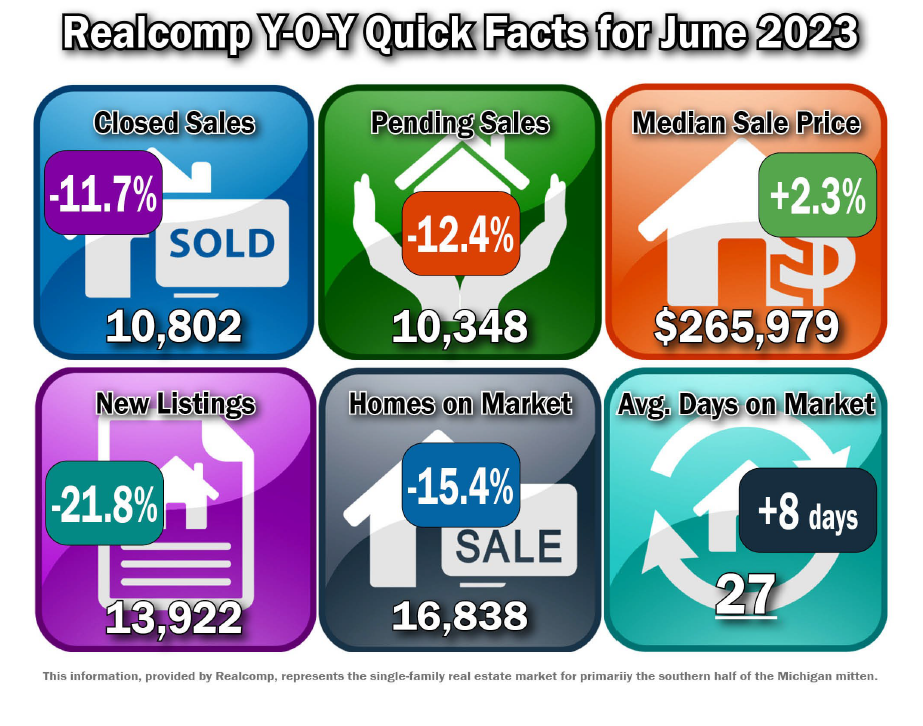
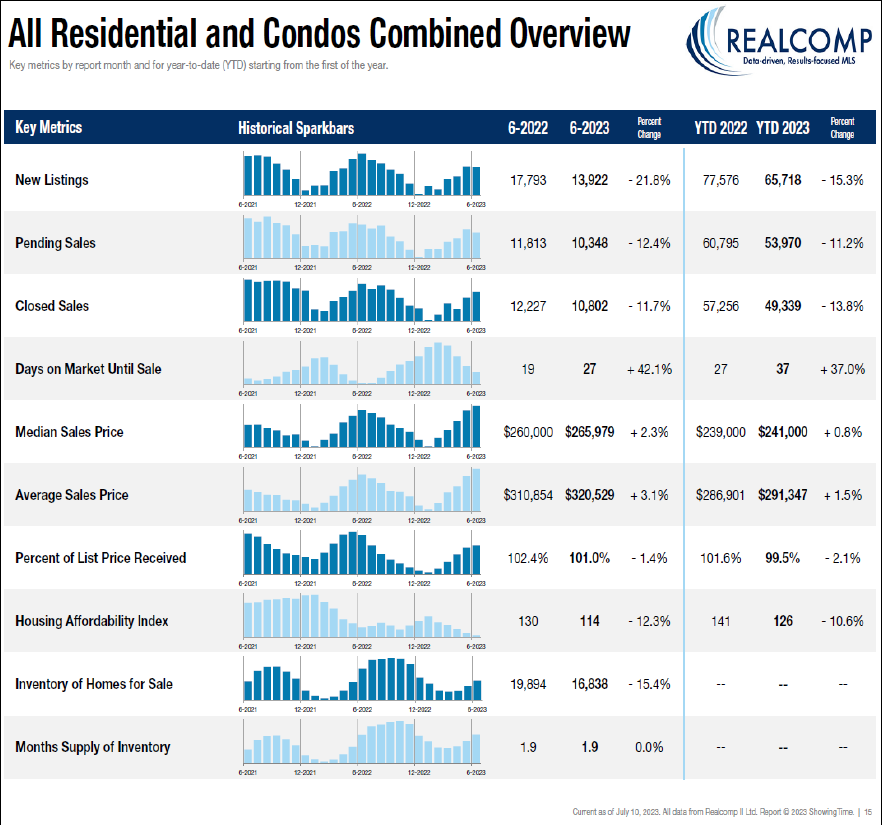
- New Listings decreased by 21.8% from 17,793 to 13,922.
- Pending Sales decreased by 12.4% from 11,813 to 10,348.
- Closed Sales decreased by 11.7% from 12,227 to 10,802.
- Average days on Market (DOM) increased by 8 days from 19 to 27.
- Median Sale Price increased by 2.3% from $260,000 to $265,979.
- Percent of last list price received decreased by 1.4% from 102.4% to 101.0%.
- Inventory of Homes for Sale increased by 15.4% from 19,894 to 16,838.
- Months-Supply of Inventory stayed the same at 1.9.
- Average Showings per Home increased by 1.9 from 9.2 to 11.1.
- Listings that were both listed and pended in the same month were at 1,134. This represents 11% of the new listings for the month and 11% of the pended listings.
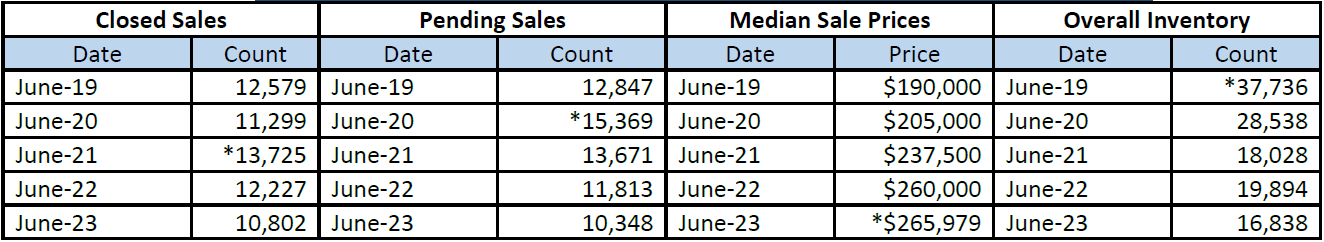
June 5-Year Perspectives -- Residential & Condos Combined -- All MLS
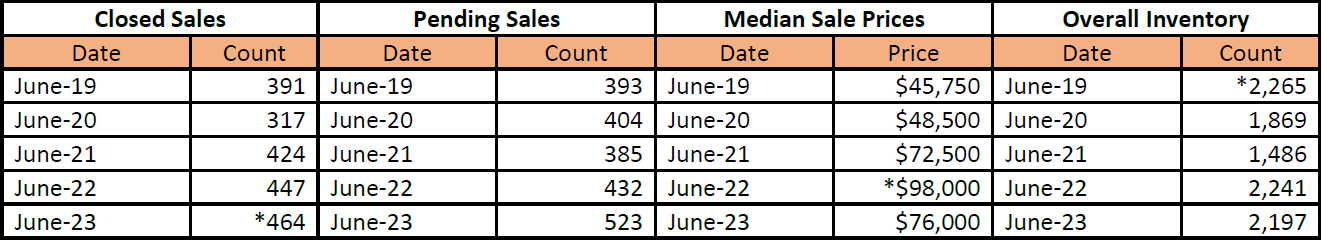
June 5-Year Perspectives -- Residential & Condos Combined – City of Detroit Numbers
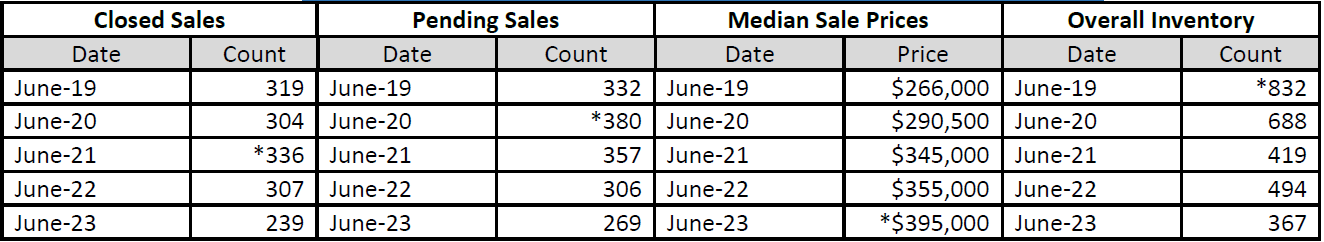
June 5-Year Perspectives -- Residential & Condos Combined -- Livingston County
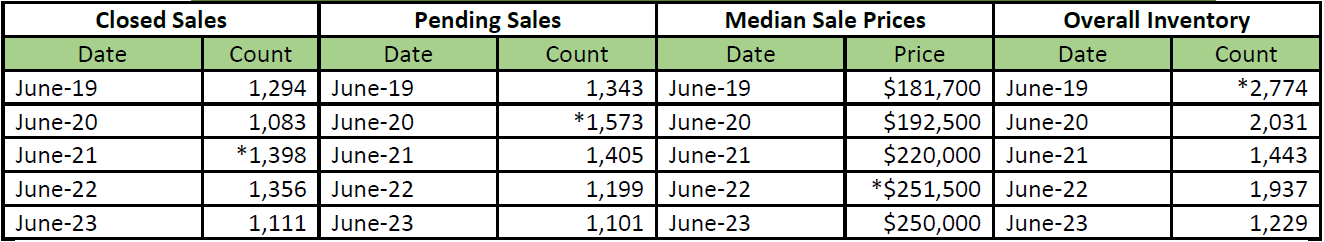
June 5-Year Perspectives -- Residential & Condos Combined -- Macomb County Numbers
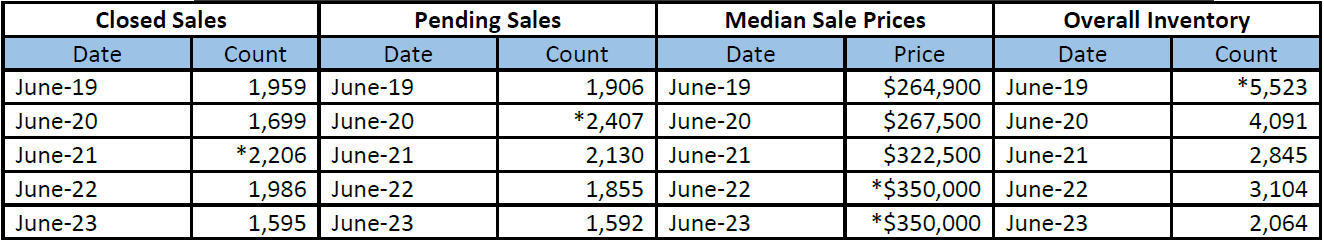
June 5-Year Perspectives -- Residential & Condos Combined -- Oakland County Numbers
June 5-Year Perspectives -- Residential & Condos Combined -- Wayne County Numbers
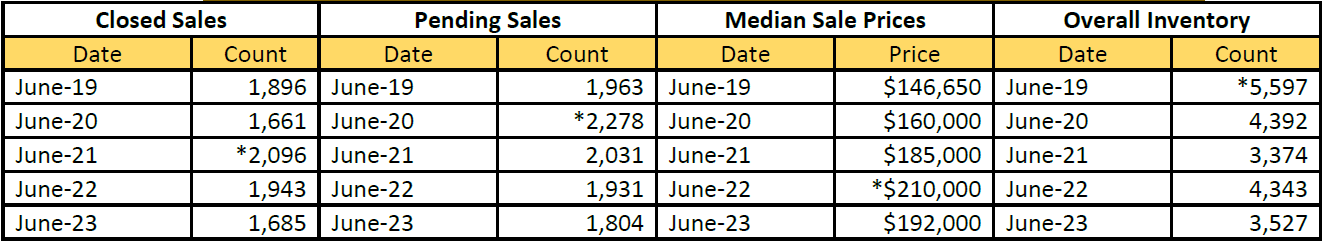
*high points noted with an asterisk.
It’s important to note that these numbers present a high-level view of what is happening in the real estate market in the lower part of Michigan and in specific regions. Be sure to contact a REALTOR® for their expertise about local markets. Find a REALTOR® in your market at www.MoveInMichigan.com.
Realcomp Shareholder Boards & Associations of REALTORS®:
- DABOR, Andrea Kuentz, Interim CEO, 313-278-2220
- DAR, Sharon Armour, EVP, 313-962-1313
- ETAR, Laura VanHouteghen, 810-982-6889
- GPBR, Bob Taylor, CEO, 313-882-8000
- LUTAR, 810-664-0271
- LCAR, Pam Leach, EVP, 810-225-1100
- NOCBOR, Patricia Jacobs, EVP, 248-674-4080