Inventory Increases Slightly in April
As Sales Slow, Months-Supply of Homes on Market
Increases 23% Y-O-Y
National Real Estate Commentary
U.S. existing-home sales declined 2.4 percent month-over-month as of last measure, according to the National Association of REALTORS® (NAR), reversing February’s sales gain of 14.5%. Fluctuations in mortgage interest rates have caused buyers to pullback, with pending sales dropping 5.2% month-over-month. Meanwhile, the median existing-home sales price declined for the second month in a row, falling 0.9% nationally from the same time last year, the largest year-over-year decline since January 2012, according to NAR.
Housing inventory remains tight nationwide, with only 980,000 units available for sale heading into April, a 5.4% increase from one year earlier, although the number of homes for sale is down compared to the same period in 2019, prior to the pandemic. The lack of existing inventory continues to impact home sales, and with only 2.6 months’ supply of homes at last measure, competition for available properties remains strong, especially in certain price categories, with multiple offers occurring on about a third of properties, according to NAR.
April-Local Activity
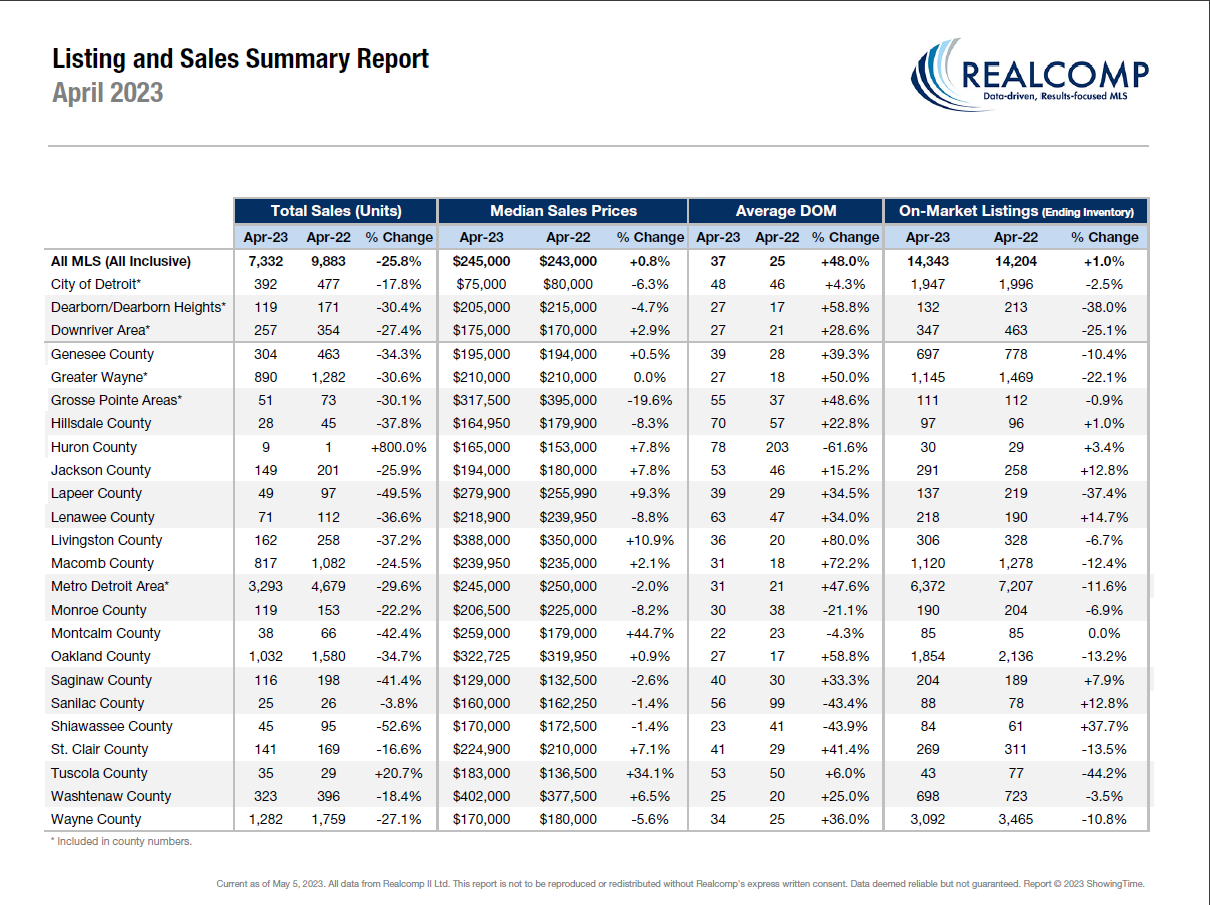
Closed Sales decreased 26.9 percent for Residential homes and 18.4 percent for Condo homes. Pending Sales decreased 17.0 percent for Residential homes and 9.4 percent for Condo homes. Inventory remained flat for Residential homes but increased 8.0 percent for Condo homes.
The Median Sales Price decreased 0.8 percent to $243,150 for Residential homes but increased 6.4 percent to $250,000 for Condo homes. Days on Market increased 48.0 percent for Residential homes and 40.0 percent for Condo homes. Months Supply of Inventory increased 15.4 percent for Residential homes and 21.4 percent for Condo homes.
“It was good to see an uptick in inventory in April,” said Karen Kage, CEO, Realcomp II Ltd. “That, along with a steadying of the median sale price, is well-timed for future activity as we enter the traditionally active summer selling season.”
April Y-O-Y Comparison -- Residential & Condos Combined -- All MLS
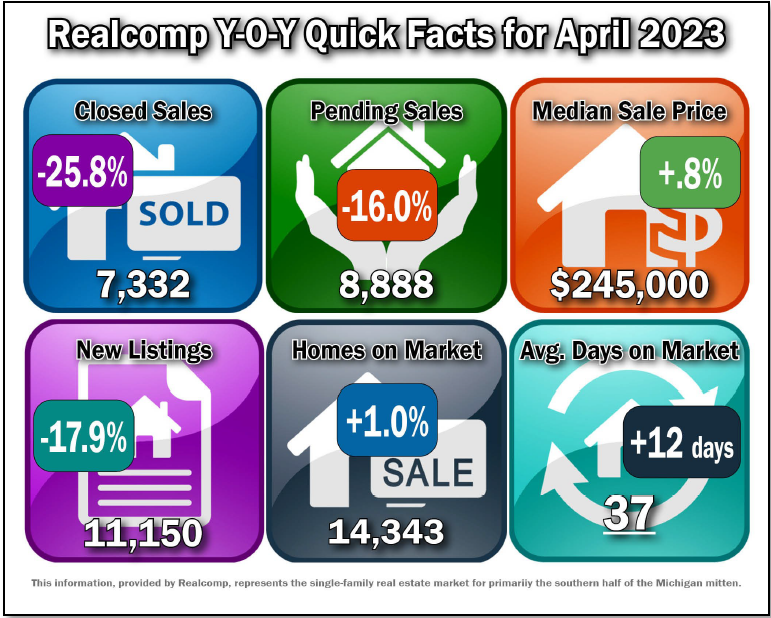
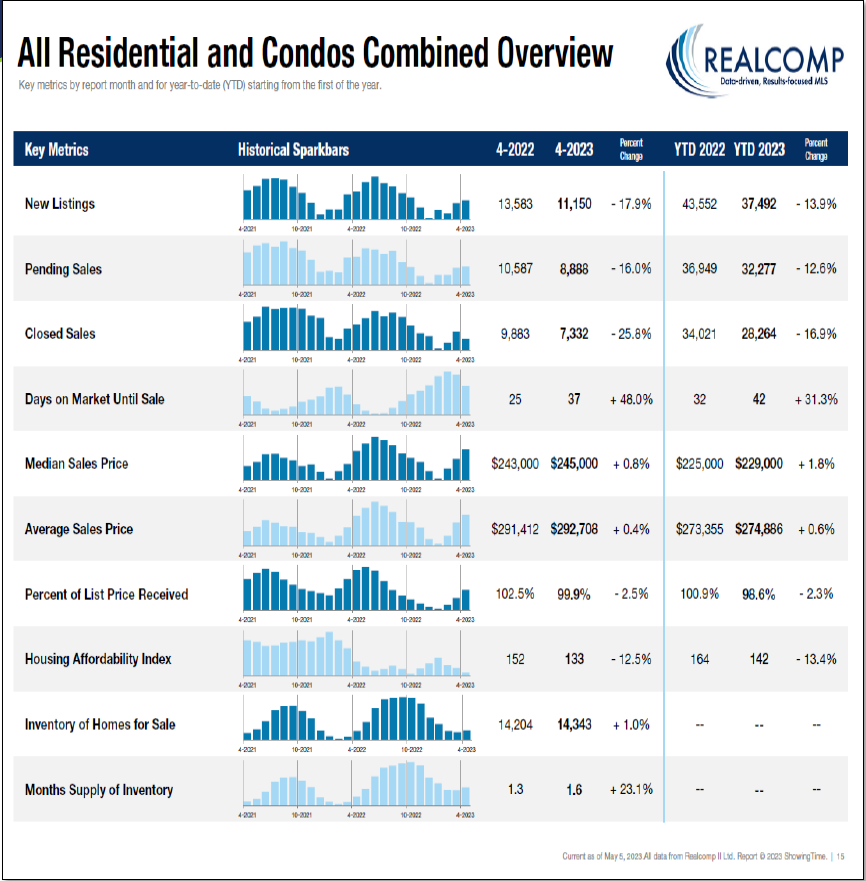
- New Listings decreased by 17.9% from 13,583 to 11,150.
- Pending Sales decreased by 16.0% from 10,587 to 8,888.
- Closed Sales decreased by 25.8% from 9,883 to 7,332.
- Average days on Market (DOM) increased by 12 days from 25 to 37.
- Median Sale Price increased by .8% from $243,000 to $245,000.
- Percent of last list price received decreased by 2.5% from 102.5% to 99.9%.
- Inventory of Homes for Sale increased by 1% from 14,204 to 14,343.
- Months-Supply of Inventory increased by 23.1% from 1.3 to 1.6.
- Average Showings per Home decreased by 2.6 from 15.3 to 12.7.
- Listings that were both listed and pended in the same month were at 4,639. This represents 41.6% of the new listings for the month and 52.2% of the pended listings.
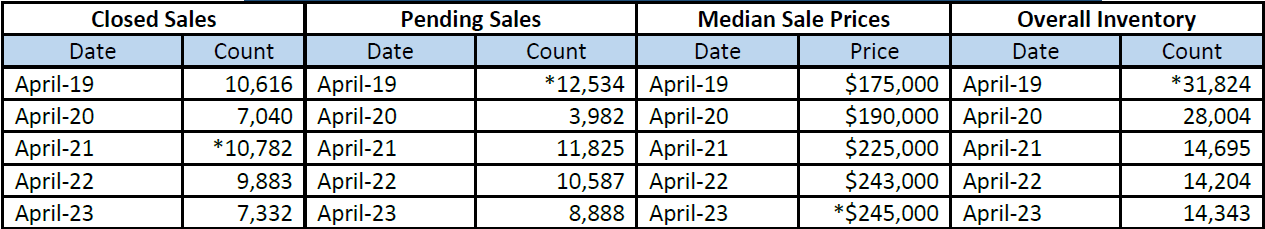
April 5-Year Perspectives -- Residential & Condos Combined -- All MLS
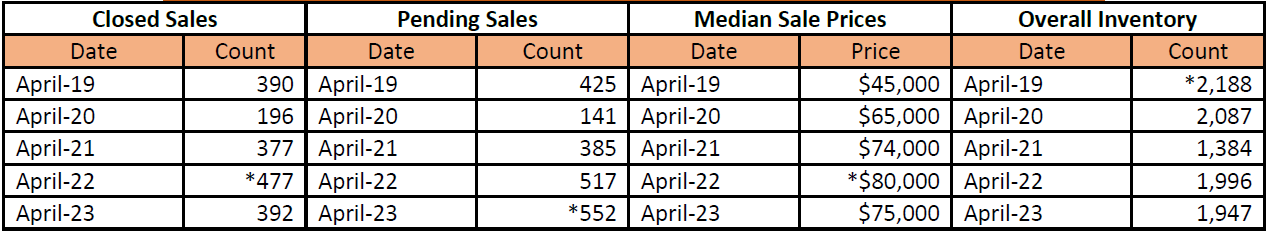
April 5-Year Perspectives -- Residential & Condos Combined – City of Detroit Numbers
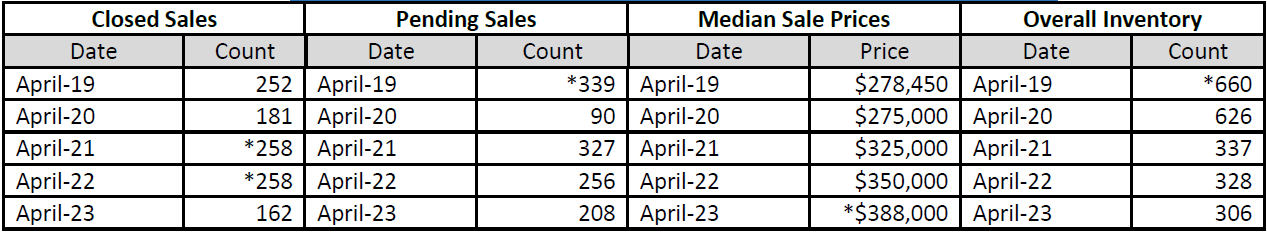
April 5-Year Perspectives -- Residential & Condos Combined -- Livingston County
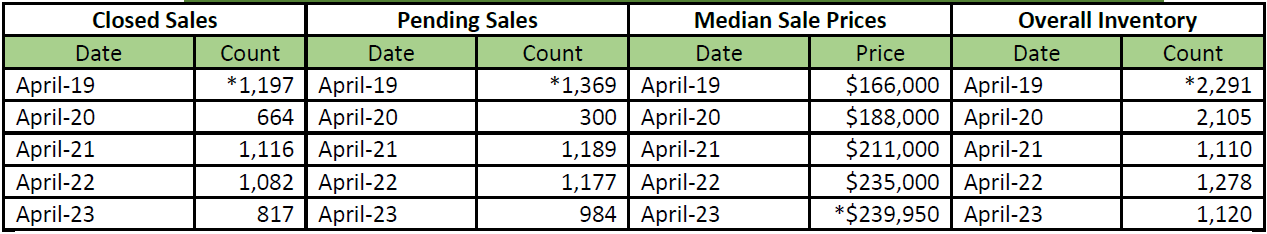
April 5-Year Perspectives -- Residential & Condos Combined -- Macomb County Numbers
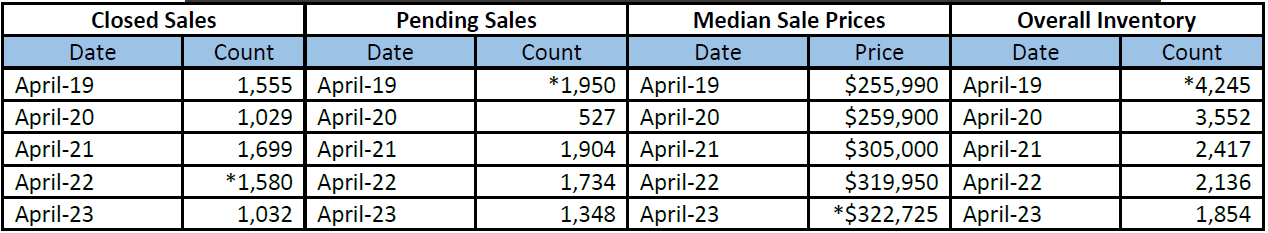
April 5-Year Perspectives -- Residential & Condos Combined -- Oakland County Numbers
April 5-Year Perspectives -- Residential & Condos Combined -- Wayne County Numbers
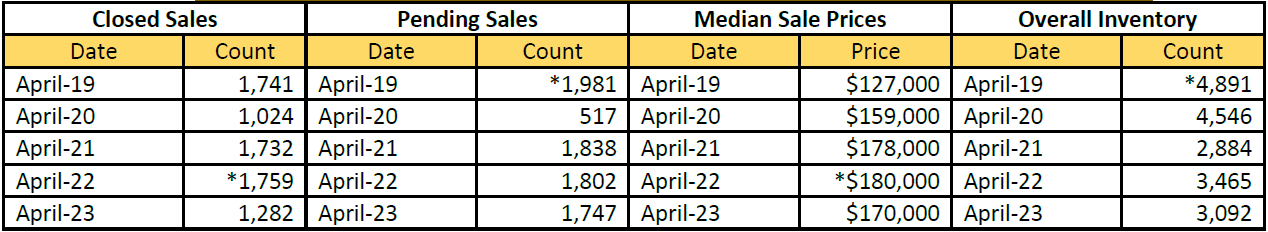
*high points noted with an asterisk.
It’s important to note that these numbers present a high-level view of what is happening in the real estate market in the lower part of Michigan and in specific regions. Be sure to contact a REALTOR® for their expertise about local markets.
Realcomp Shareholder Boards & Associations of REALTORS®:
- DABOR, Andrea Kuentz, Interim CEO, 313-278-2220
- DAR, Sharon Armour, EVP, 313-962-1313
- ETAR, Laura VanHouteghen, 810-982-6889
- GPBR, Bob Taylor, CEO, 313-882-8000
- LUTAR, 810-664-0271
- LCAR, Pam Leach, EVP, 810-225-1100
- NOCBOR, Patricia Jacobs, EVP, 248-674-4080