
National Real Estate Commentary
U.S. existing-home sales rose from a 13-year low, climbing 0.8% from the previous month and breaking a five-month streak in which sales declined, according to the National Association of REALTORS® (NAR). Despite the increase, sales were down 7.3% compared to the same period last year, as affordability challenges continue to hinder prospective buyers. Most of this period’s closed sales went under contract in October, when mortgage rates were at a two-decade high. With rates having dropped more than a full percentage point since then, existing-home sales may continue to pick up in the months ahead.
Low levels of inventory continue to impact U.S. home sales, offering few options for aspiring buyers to choose from. Going into December there were 1.13 million units for sale, down 1.7% from the previous month but up 0.9% from the same period last year, for a 3.5 months’ supply at the current sales pace. As a result, sales prices remain high nationwide, with NAR reporting the median existing-home price rose 4% annually to $387,600 as of last measure, the fifth consecutive month of year-over-year price gains. Homebuyer demand is picking up, and without a significant increase in supply, experts believe home prices will likely remain elevated for some time to come.
December-Local Activity
Closed Sales decreased 7.9 percent for Residential homes and 10.5 percent for Condo homes. Pending Sales decreased 3.2 percent for Residential homes but increased 0.3 percent for Condo homes. Inventory decreased 8.8 percent for Residential homes but increased 4.0 percent for Condo homes.
The Median Sales Price increased 7.9 percent to $232,000 for Residential homes and 7.4 percent to $247,000 for Condo homes. Days on Market decreased 2.7 percent for Residential homes and 7.3 percent for Condo homes. Months Supply of Inventory remained flat for Residential homes but increased 11.1 percent for Condo homes.
“It is quite interesting to see new listings increase, and significantly, in December – a month where traditionally houses come temporarily ‘off market’ to avoid scheduled showings over the holiday,” said Karen Kage, CEO, Realcomp II Ltd. “This would seem to indicate a renewed confidence in the marketplace by those looking to sell. Very good news for those looking to buy as we move into 2024.”
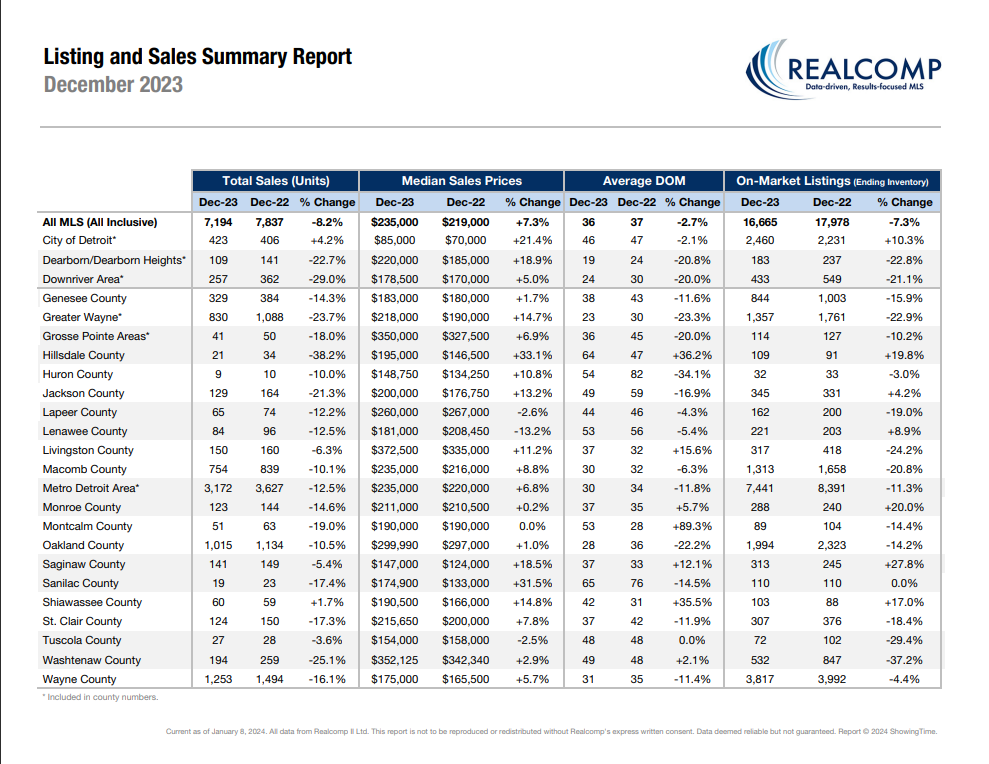
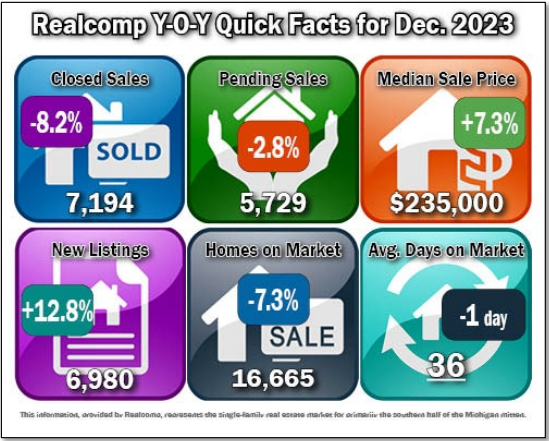
December Y-O-Y Comparison -- Residential & Condos Combined -- All MLS
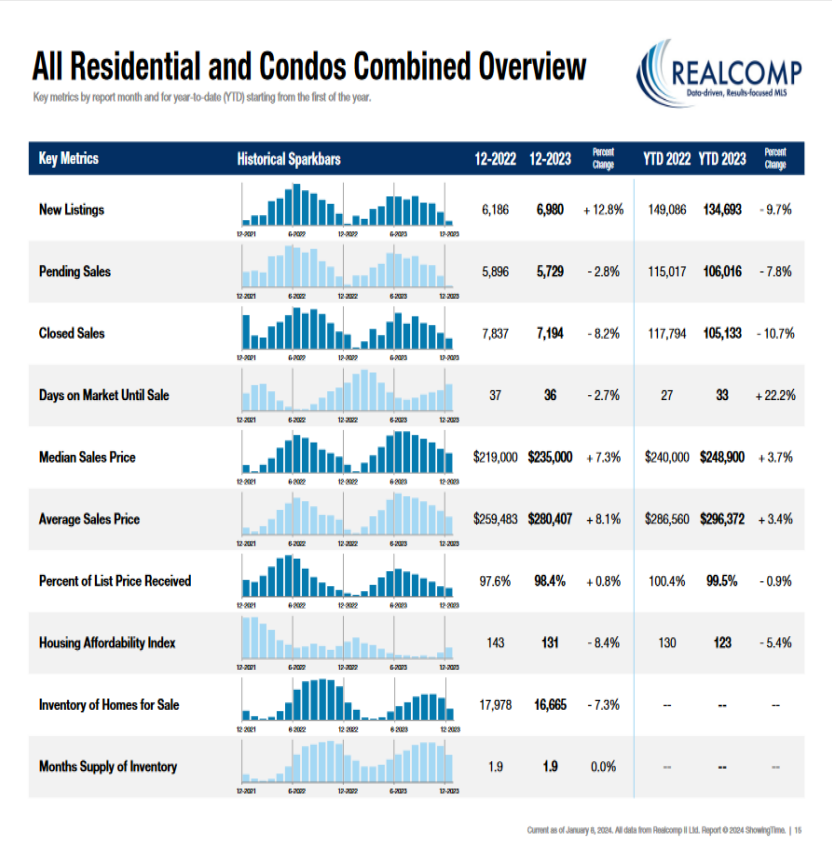
- New Listings increased by 12.8% from 6,186 to 6,980.
- Pending Sales decreased by 2.8% from 5,896 to 5,729.
- Closed Sales decreased by 8.2% from 7,837 to 7,194.
- Average days on Market (DOM) decreased by 1 day from 37 to 36.
- Median Sale Price increased by 7.3% from $219,000 to $235,000.
- Percentage of last list price received increased slightly by .8% from 97.6% to 98.4%.
- Inventory of Homes for Sale decreased by 7.3% from 17,978 to 16,665.
- Months-Supply of Inventory held at 1.9.
- Average Showings per Home increased slightly from 5.6 to 6.2.
- Listings that were both listed and pended in the same month were at 1,831. This represents 26.2% of the new listings for the month and 32% of the pended listings.
2023 End of Year Cumulative Summary
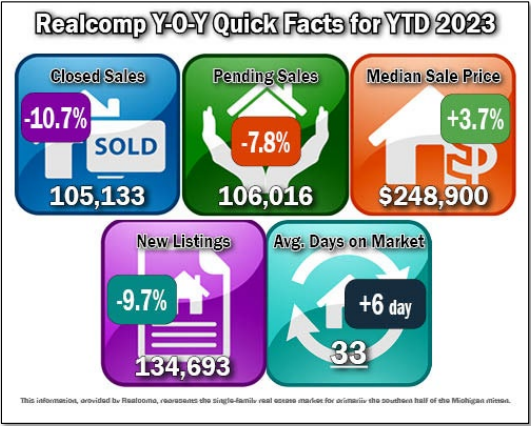
2023 End of Year Cumulative Summary -- Residential & Condos Combined -- All MLS
- Closed Sales decreased by 10.7% from 117,794 to 105,133.
- Pending Sales decreased by 7.8% from 115,017 to 106,016.
- Median Sale Price increased by 3.7% from $240,000 to $248,900.
- New Listings decreased by 9.7% from 149,086 to 134,693.
- Average days on Market (DOM) increased by 6 days from 27 to 33.
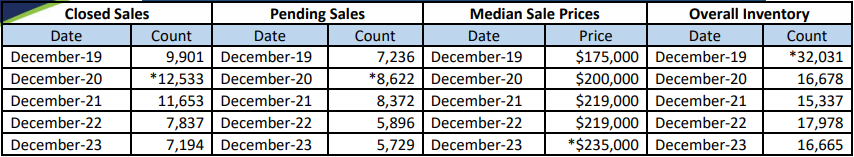
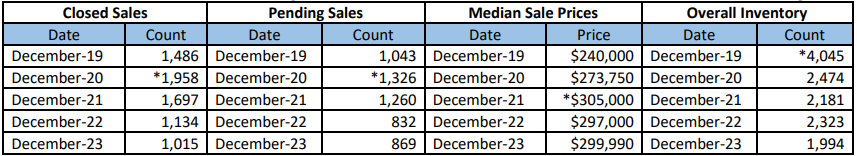
December 5-Year Perspectives -- Residential & Condos Combined -- All MLS
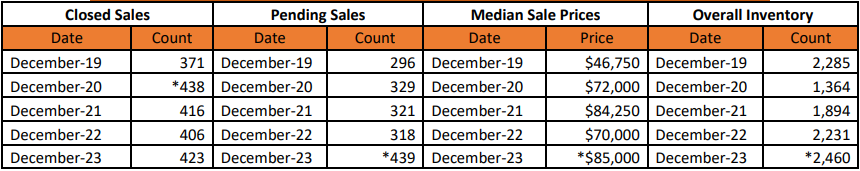
December 5-Year Perspectives -- Residential & Condos Combined – City of Detroit Numbers
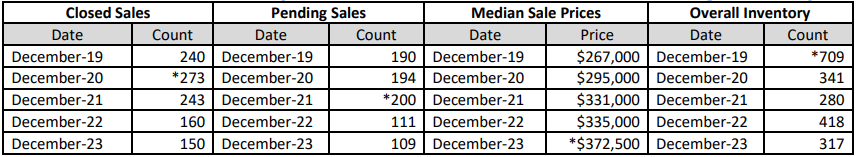
December 5-Year Perspectives -- Residential & Condos Combined -- Livingston County
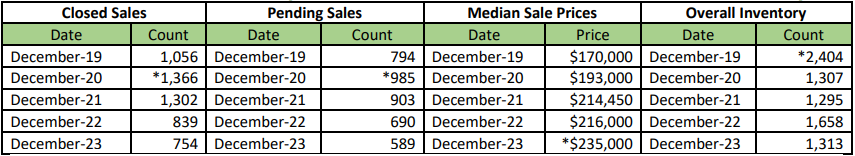
December 5-Year Perspectives -- Residential & Condos Combined -- Macomb County Numbers
December 5-Year Perspectives -- Residential & Condos Combined -- Oakland County Numbers
December 5-Year Perspectives -- Residential & Condos Combined -- Wayne County Numbers
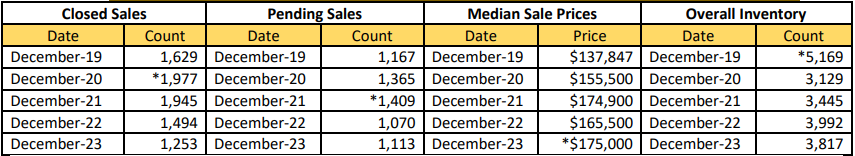
*high points noted with an asterisk.
It’s important to note that these numbers present a high-level view of what is happening in the real estate market in the lower part of Michigan and in specific regions. Be sure to contact a REALTOR® for their expertise about local markets. Find a REALTOR® in your market at www.MoveInMichigan.com.
Realcomp Shareholder Boards & Associations of REALTORS®:
- DABOR, Andrea Kuentz, Interim CEO, 313-278-2220
- DAR, Sharon Armour, EVP, 313-962-1313
- ETAR, Laura VanHouteghen, 810-982-6889
- GPBR, Bob Taylor, CEO, 313-882-8000
- LUTAR, 810-664-0271
- LCAR, Pam Leach, EVP, 810-225-1100
- NOCBOR, Patricia Jacobs, EVP, 248-674-4080