
National Real Estate Commentary
U.S. existing-home sales fell for the first time since September, slipping 4.9% month-over-month to a seasonally adjusted annual rate of 4.08 million units, according to the National Association of REALTORS® (NAR), as elevated home prices and higher interest rates continue to impact buyer activity. Despite the drop, sales were up 2% compared to the same period last year, marking the fourth consecutive monthly year-over-year increase.
The limited number of properties for sale has continued to push home prices higher nationwide. At last measure, the national median existing-home price was $396,900, a 4.8% increase from one year earlier, with prices up in all four regions, according to NAR. Meanwhile, total housing inventory heading into February stood at 1.18 million units, up 3.5% month-over-month and 16.8% year-overyear, for a 3.5-month supply at the current sales pace.
February-Local Activity
Closed Sales decreased 8.2 percent for Residential homes and 14.5 percent for Condo homes. Pending Sales decreased 14.8 percent for Residential homes and 14.2 percent for Condo homes. Inventory increased 12.2 percent for Residential homes and 18.0 percent for Condo homes.
The Median Sales Price increased 7.6 percent to $255,000 for Residential homes and 4.0 percent to $260,000 for Condo homes. Days on Market increased 13.6 percent for Residential homes and 6.8 percent for Condo homes. Month’s Supply of Inventory increased 12.5 percent for Residential homes and 21.1 percent for Condo homes.
“Market factors have slowed home sales,” said Karen Kage, CEO, Realcomp II Ltd. “As a result, properties are staying on the market longer, growing inventory levels. Active buyers now have more homes to choose from and a little more time for decisions going into the spring market – a benefit last year’s buyers didn’t have.
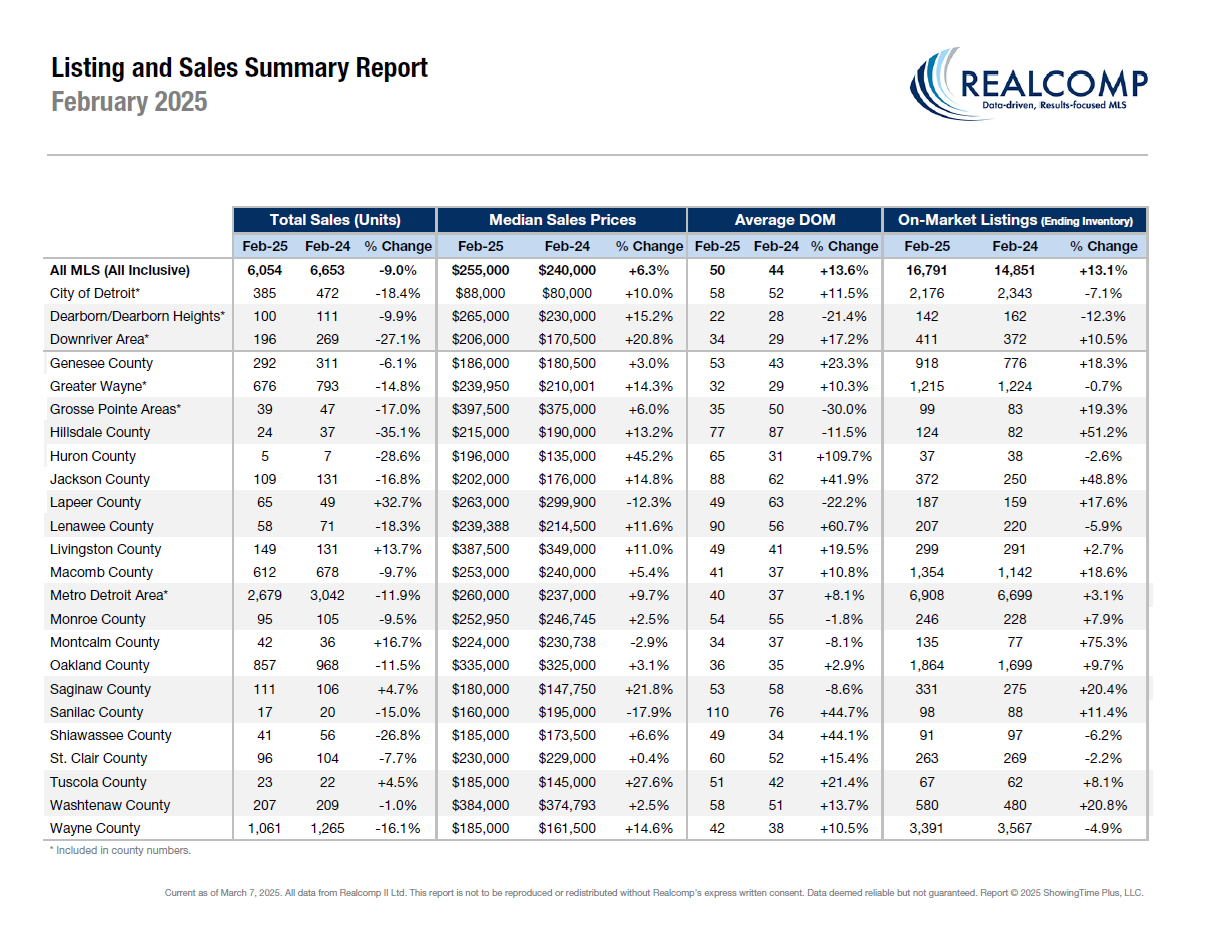
February Y-O-Y Comparison -- Residential & Condos Combined -- All MLS
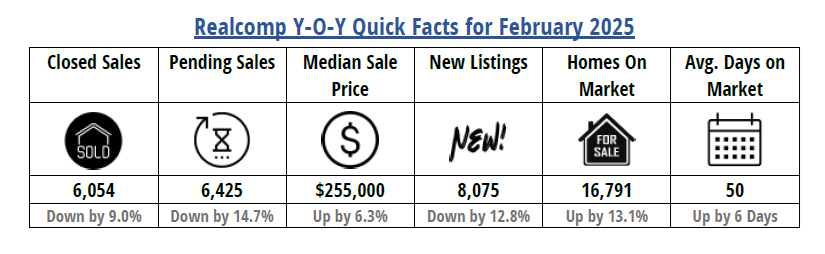
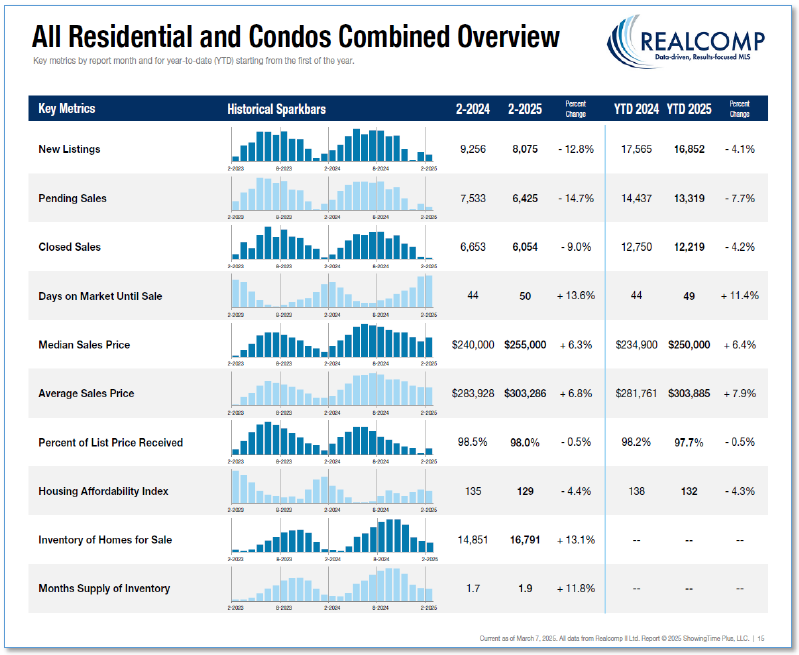
- New Listings decreased by 12.8% from 9,256 to 8,075.
- Pending Sales decreased by 14.7% from 7,533 to 6,425.
- Closed Sales decreased by 9.0% from 6,653 to 6,054.
- Average days on Market (DOM) increased by 6 days from 44 to 50.
- Median Sale Price increased by 6.3% from $240,000 to $255,000.
- Percentage of last list price received decreased slightly by .5% from 98.5% to 98.0%.
- Inventory of Homes for Sale increased by 13.1% from 14,851 to 16,791.
- Month’s Supply of Inventory increased by 11.8% from 1.7 to 1.9.
- Average Showings per Home decreased from 10.3 to 8.1.
- Listings that were both listed and pended in the same month were at 2,321. This represents 28.7% of the new listings for the month and 36.1% of the pended listings.
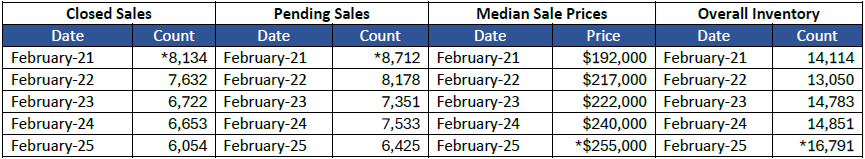
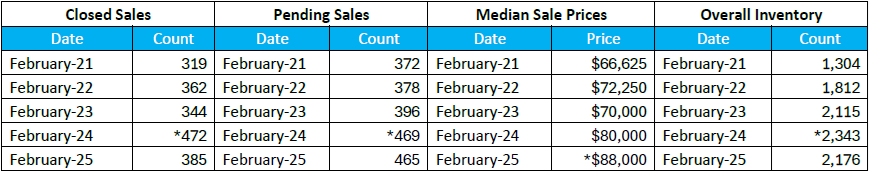
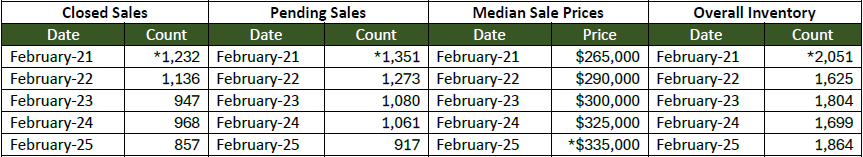
February 5-Year Perspectives -- Residential & Condos Combined -- All MLS
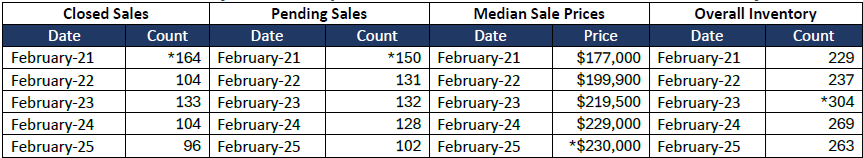
February 5-Year Perspectives -- Residential & Condos Combined – City of Detroit Numbers
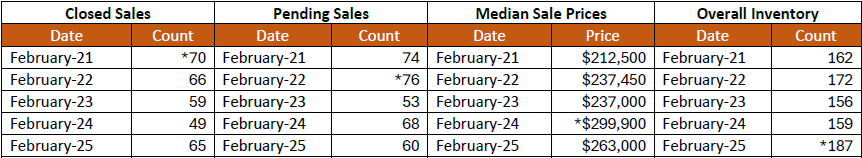
February 5-Year Perspectives -- Residential & Condos Combined -- Lapeer County Numbers
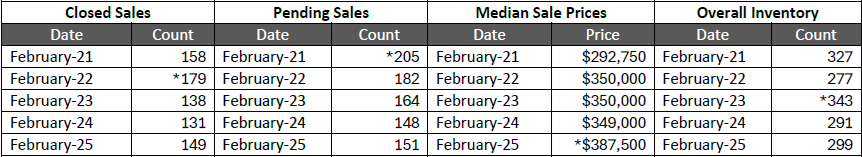
February 5-Year Perspectives -- Residential & Condos Combined -- Livingston County
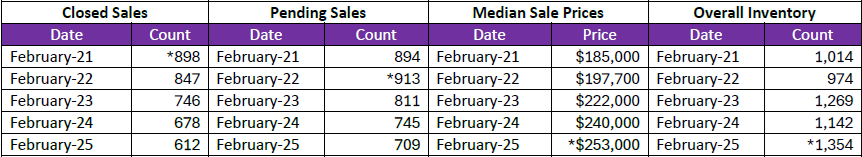
February 5-Year Perspectives -- Residential & Condos Combined -- Macomb County Numbers
February 5-Year Perspectives -- Residential & Condos Combined -- Oakland County Numbers
February 5-Year Perspectives -- Residential & Condos Combined -- St. Clair County Numbers
February 5-Year Perspectives -- Residential & Condos Combined -- Wayne County Numbers
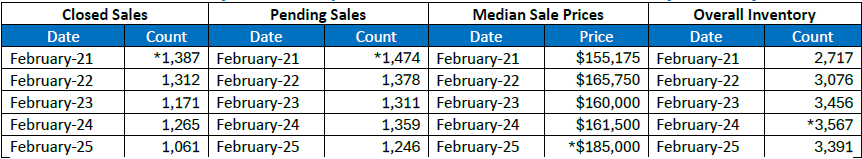
*high points noted with an asterisk.
Note: These numbers represent real estate market activity in the lower part of Michigan. Be sure to contact a REALTOR® for their expertise about local markets. Find a REALTOR® in your market at www.MoveInMichigan.com.
Realcomp Shareholder Boards & Associations of REALTORS®:
- DABOR, Andrea Kuentz, CEO, 313-278-2220
- DAR, Sharon Armour, EVP, 313-962-1313
- ETAR, Laura VanHouteghen, 810-982-6889
- GPBR, Bob Taylor, CEO, 313-882-8000
- LUTAR, 810-664-0271
- LCAR, Terri Fratarcangeli, EVP, 810-225-1100
- NOCBOR, Patricia Jacobs, EVP, 248-674-4080