
National Real Estate Commentary
U.S. existing‐home sales climbed 1.5% month‐over‐month and 4.1% year‐over‐year, reaching a seasonally adjusted annual rate of 4.06 million units, according to the National Association of REALTORS® (NAR). The increase was partly driven by falling mortgage rates, which recently hit their lowest level in more than a year. Regionally, monthly sales advanced in the Northeast, South, and West, while the Midwest experienced a slight decline.
Housing inventory edged up 1.3% from the previous month to 1.55 million units, 14.0% higher than the same period last year. This represents a 4.6‐month supply at the current sales pace, according to NAR. The median existing‐home price grew 2.1% year‐over‐year to $415,200, continuing the trend of annual price gains. The Midwest saw the largest year‐over‐year increase in median sales price, followed by the Northeast and South, while prices remained mostly flat in the West.
October-Local Activity
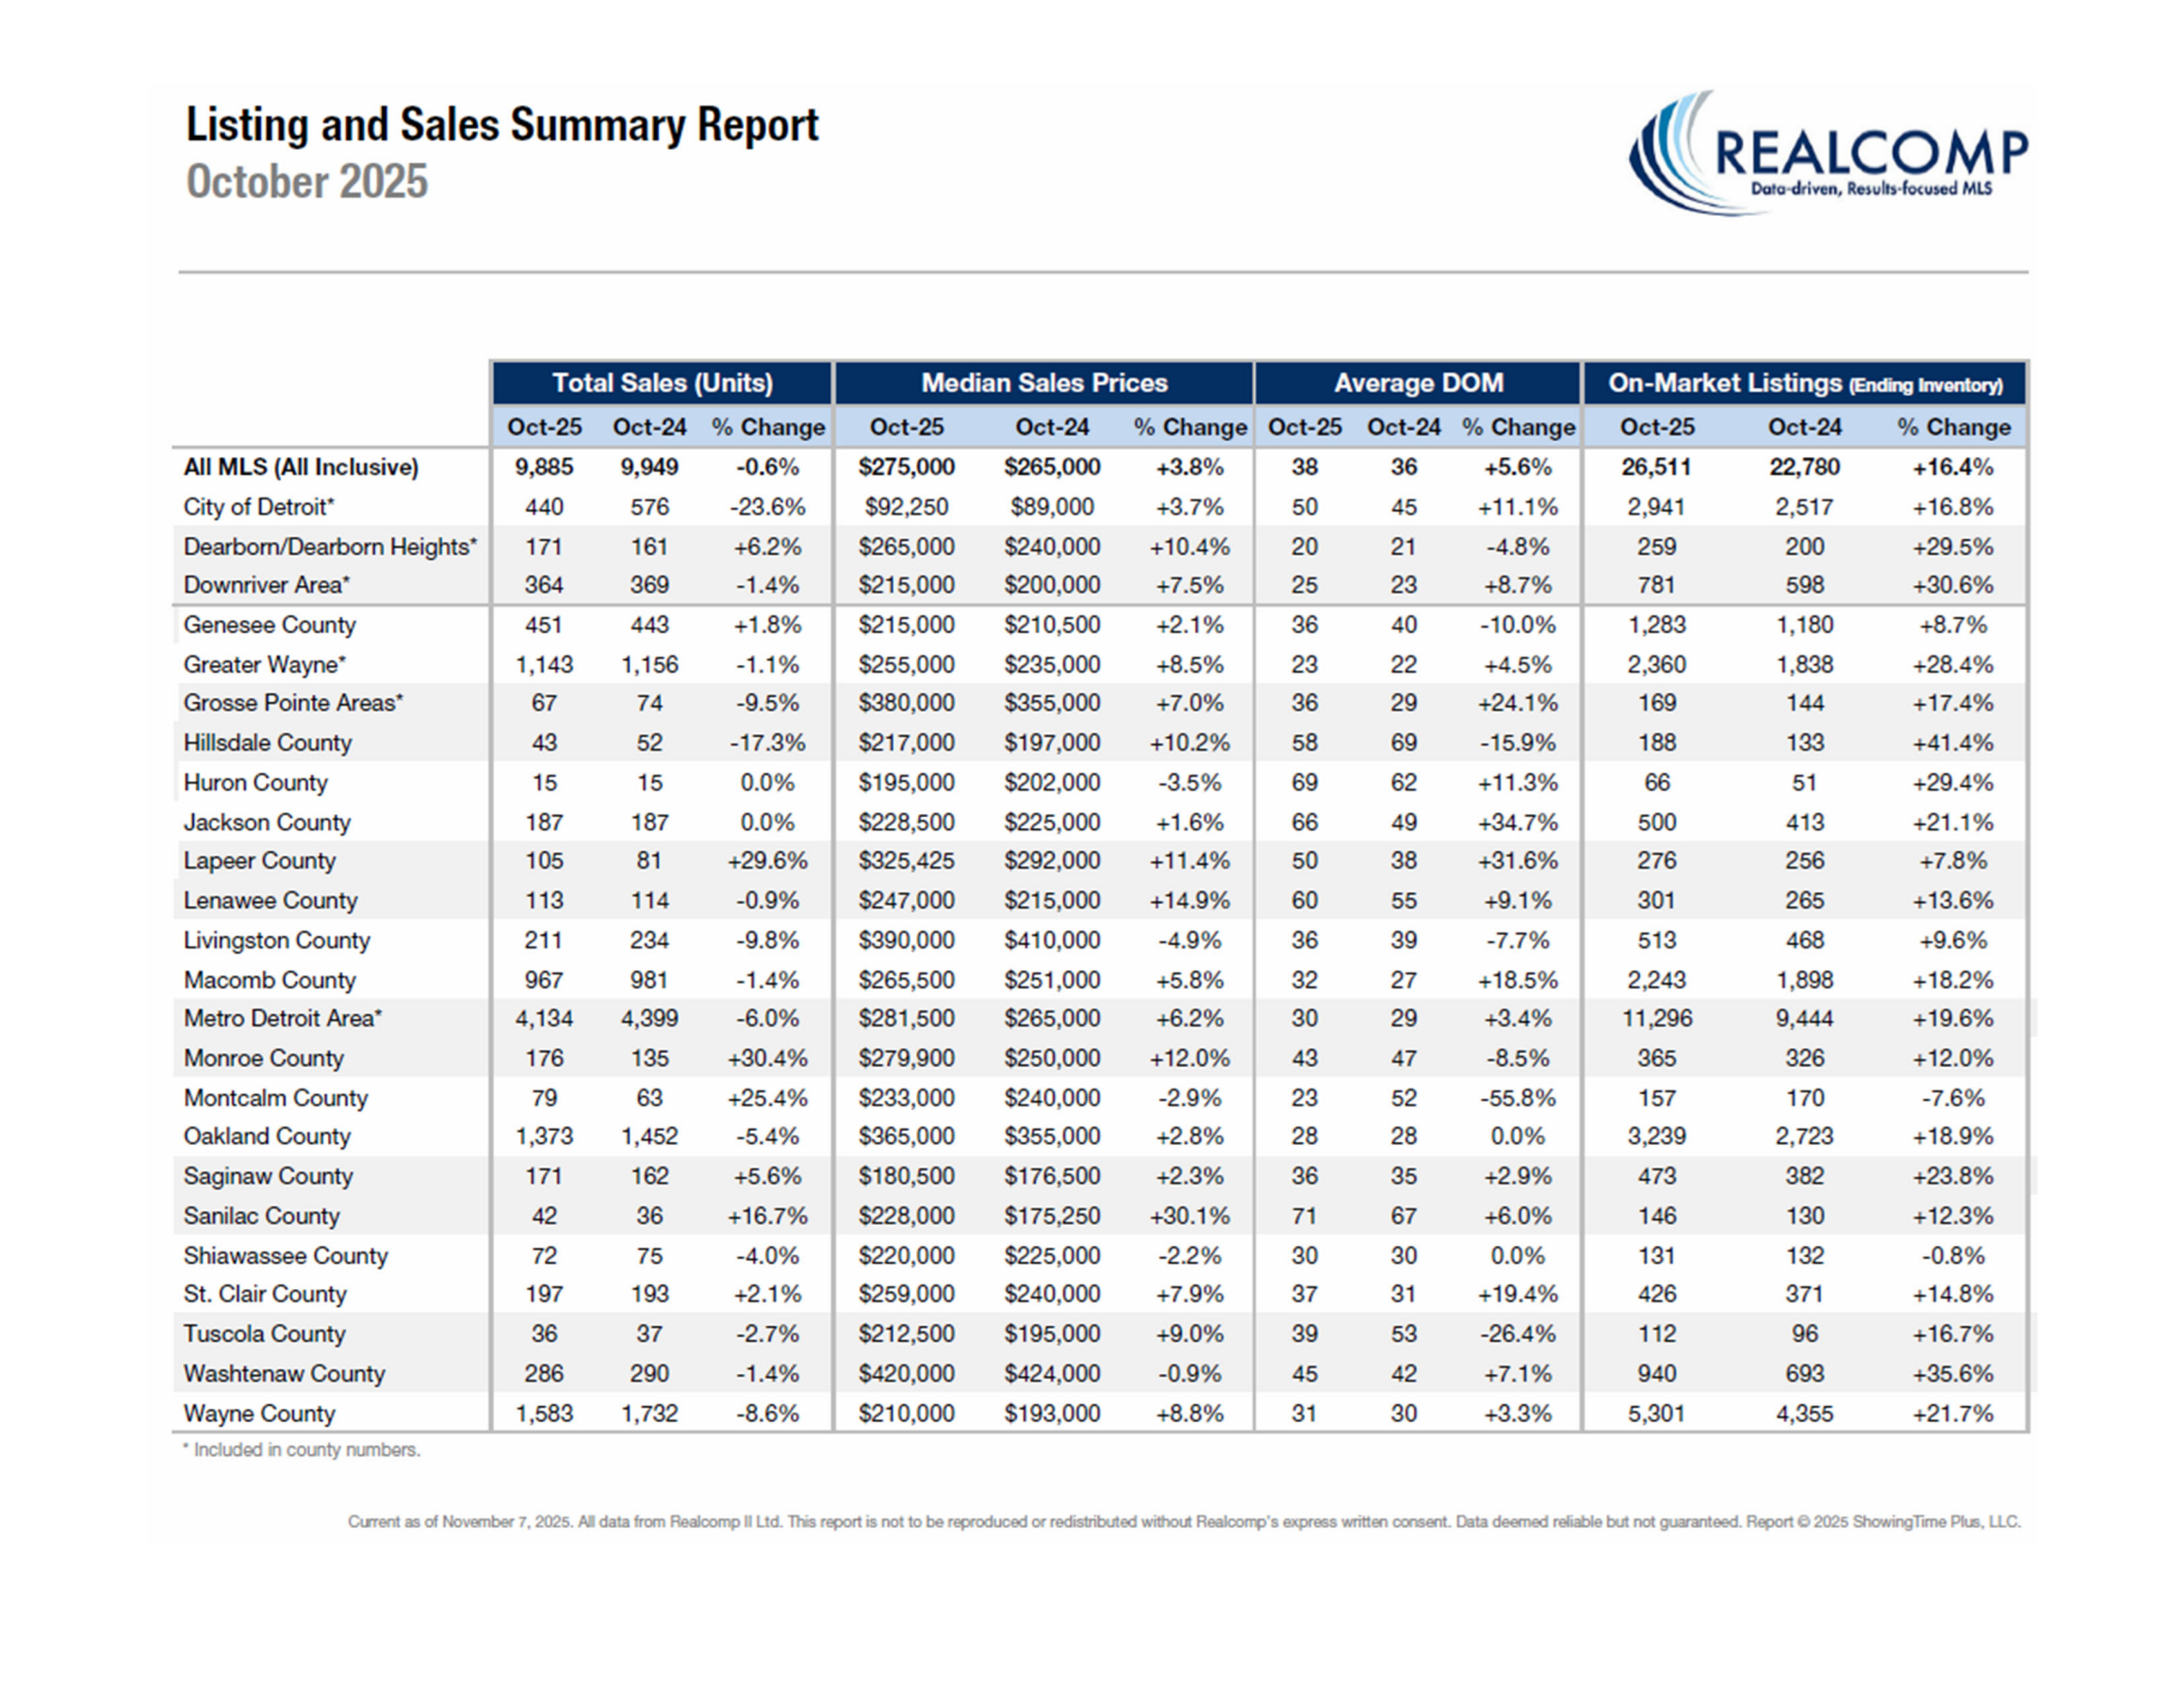
Closed Sales decreased 0.6 percent for Residential homes and 1.1 percent for Condo homes. Pending Sales decreased 5.6 percent for Residential homes and 1.6 percent for Condo homes. Inventory increased 16.0 percent for Residential homes and 18.9 percent for Condo homes.
The Median Sales Price increased 4.5 percent to $277,000 for Residential homes and 3.5 percent to $269,000 for Condo homes. Days on Market increased 5.6 percent for Residential homes and 11.1 percent for Condo homes. Months Supply of Inventory increased 16.0 percent for Residential homes and 22.2 percent for Condo homes.
October Comparisons – Res & Condo Combined - All MLS
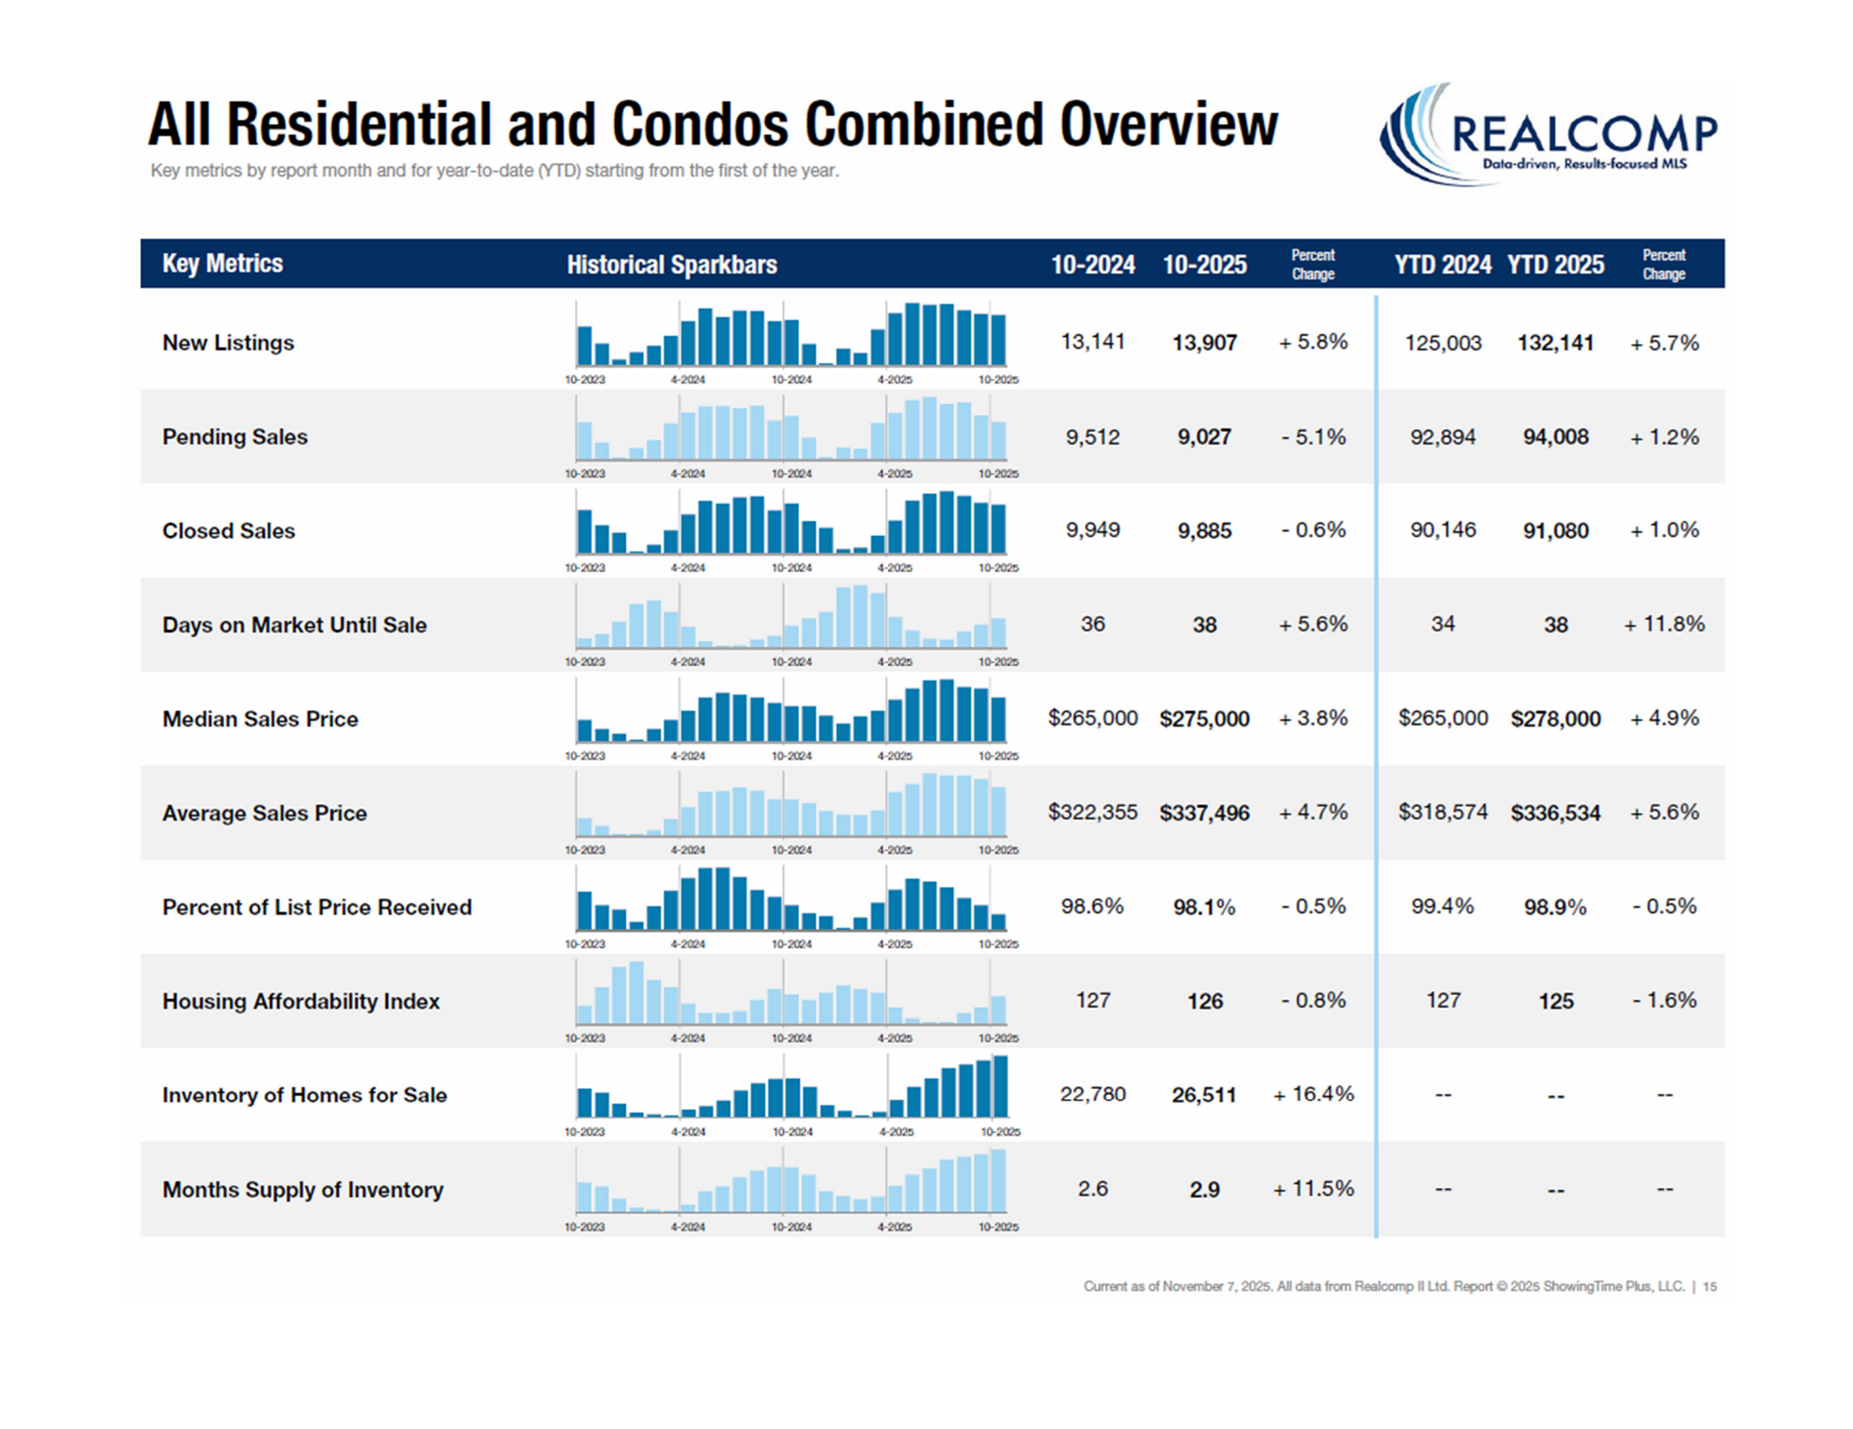
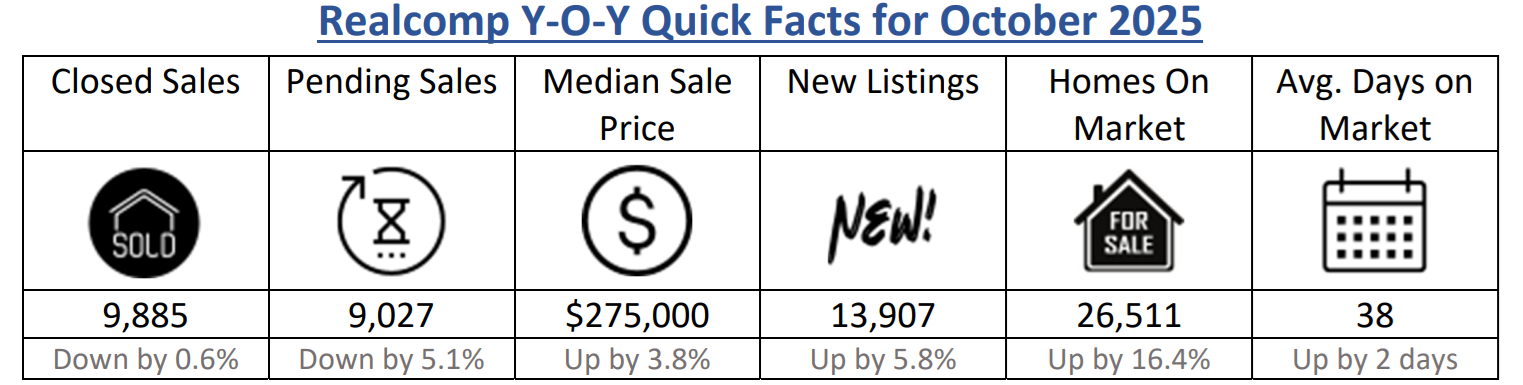
- New Listings increased by 5.8% from 13,141 to 13,907 Year‐Over‐Year (YOY). New Listings decreased from 13,974 Month‐Over‐Month (MOM), a decrease of about 0.5%.
- Pending Sales decreased by 5.1% from 9,512 to 9,027 YOY. Pending sales increased from 8,884 MOM, an increase of 1.6%.
- Closed Sales decreased by 0.6% from 9,949 to 9,885 YOY. Closed sales increased from 9,675 MOM, an increase of 2.2%.
- Average Days on Market (DOM) increased by 2 days from 36 to 38 YOY. Average Days on Market increased from 36 days MOM.
- Median Sale Price increased by 3.8% from $265,000 to $275,000 YOY. Median Sale price decreased from $285,000 MOM, a decrease of 3.5%.
- Percentage of Last List Price Received decreased slightly by .5% from 98.6% to 98.1% YOY. Percentage of Last List Price Received decreased by the same amount, .5%, MOM.
- Inventory of Homes for Sale increased by 16.4% from 22,780 to 26,511 YOY. Inventory of Homes for Sale increased from 26,296 MOM, an increase of 0.8%.
- Month’s Supply of Inventory increased by 11.5% from 2.6 to 2.9 YOY. Month’s Supply of Inventory went unchanged MOM.
- Average Showings per Home decreased from 6.7 to 4.7 YOY. Average Showings decreased from 5 MOM, a difference of .3 showings.
- Listings that were both listed and pended in the same month were at 3,412. This represents 25% of the new listings for the month and 38% of the pended listings. Listings that were both listed and pended in the same month decreased from 3,535 MOM.
“Whether due to more favorable interest rates or greater overall consumer confidence in the marketplace, new listings were up nearly 6 percent YOY,” said Karen Kage, CEO, Realcomp II LTD. “With talks of more cuts to come, we anticipate this trend continuing in the days and weeks ahead.”
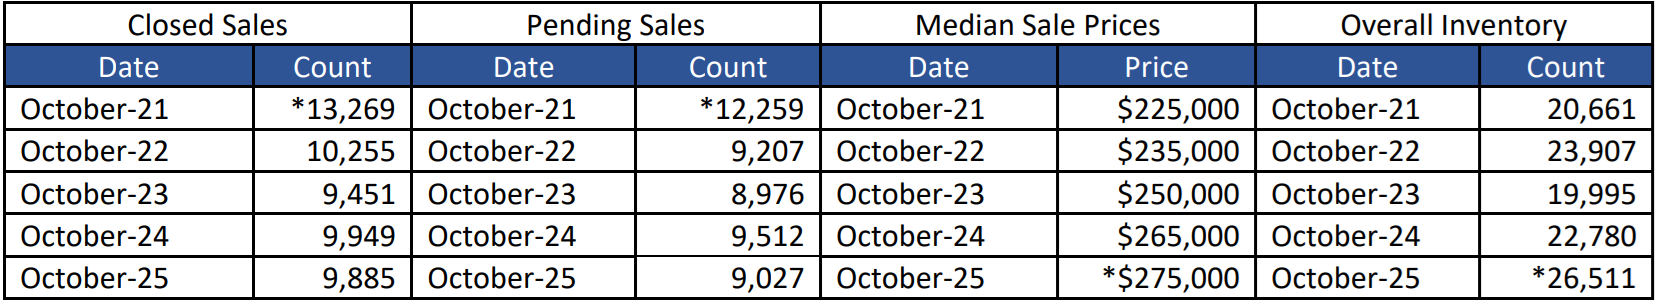
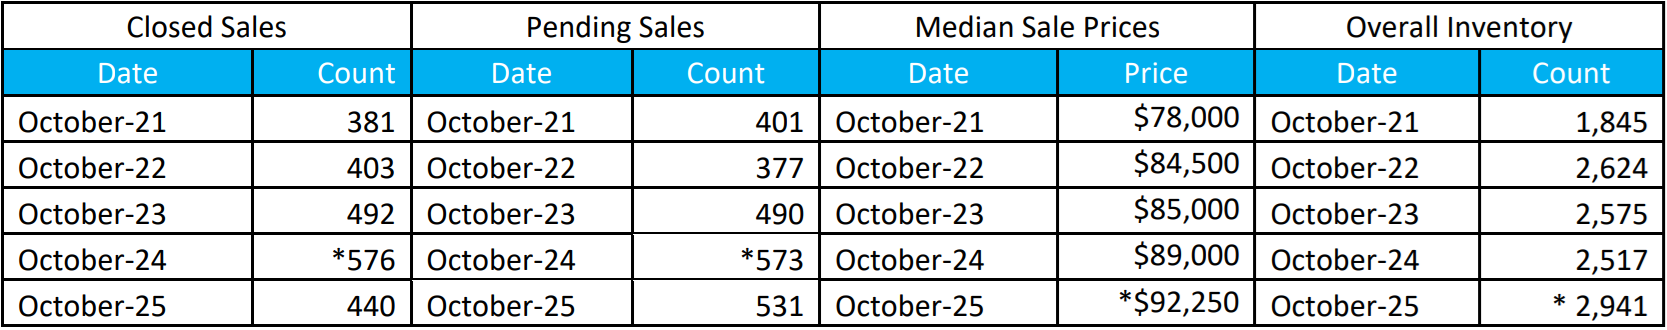
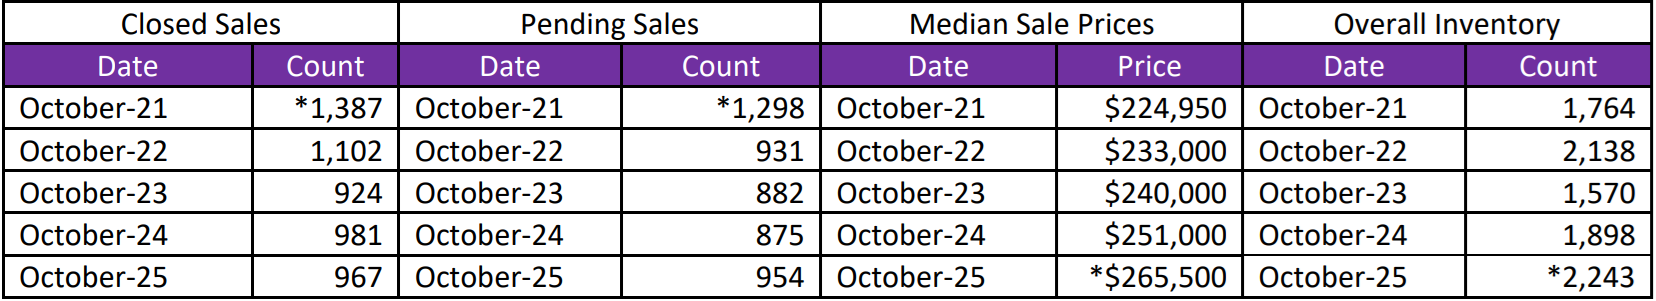
October 5-Year Perspectives -- Residential & Condos Combined -- All MLS
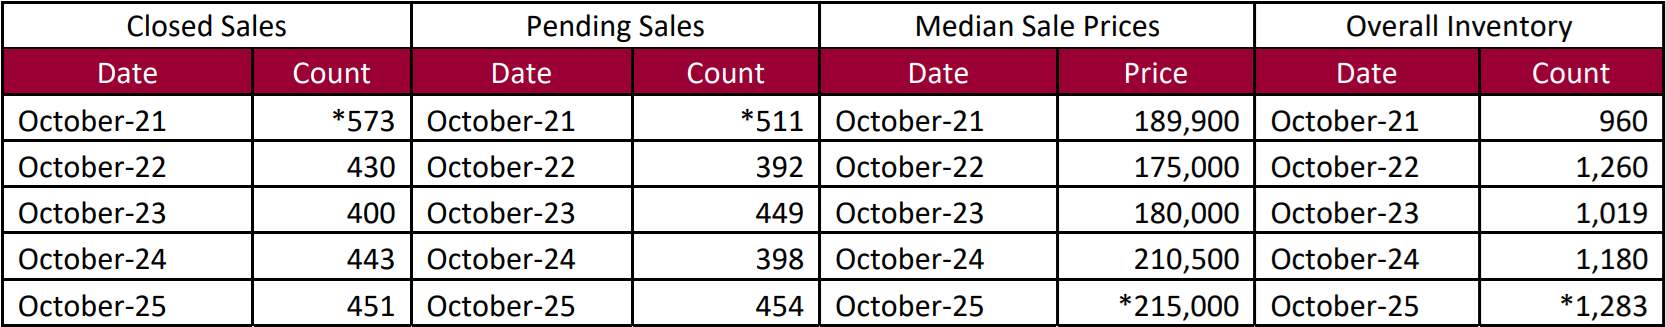
October 5-Year Perspectives -- Residential & Condos Combined – City of Detroit Numbers
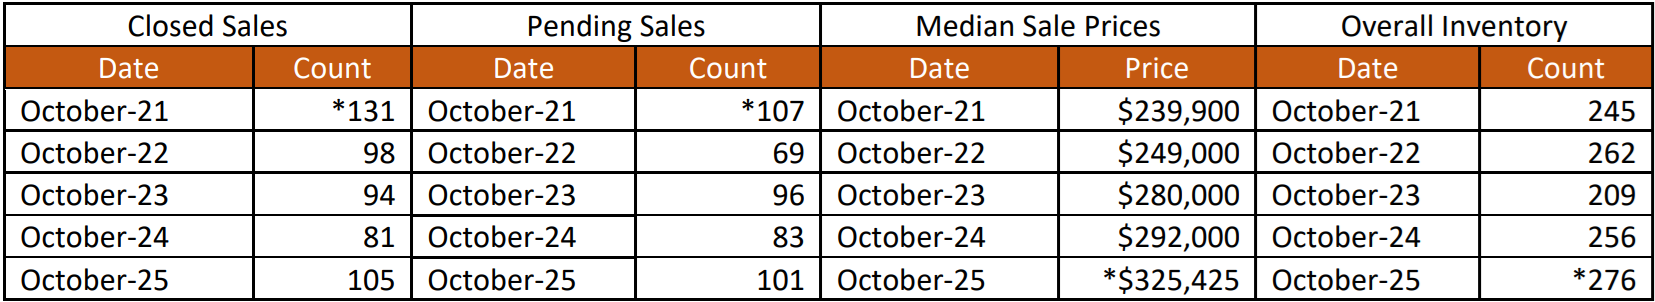
October 5-Year Perspectives -- Residential & Condos Combined -- Genessee County Numbers
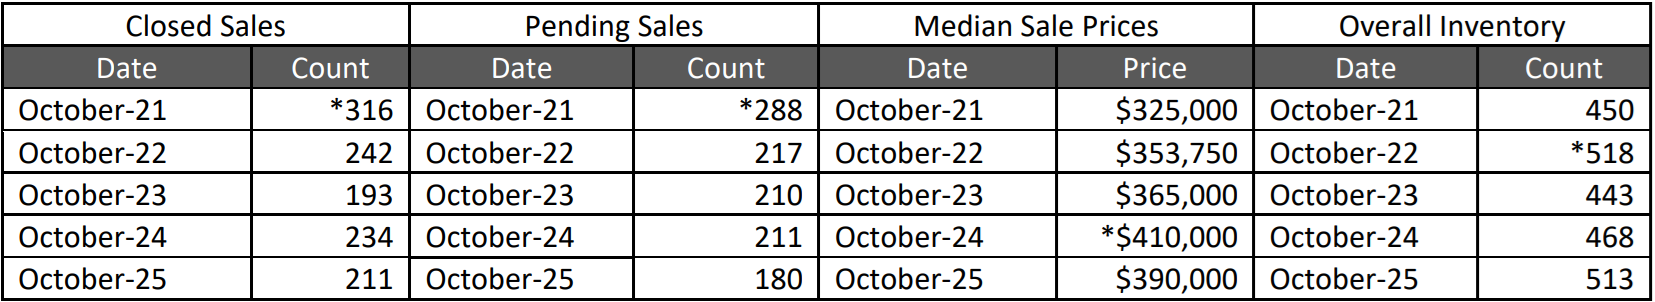
October 5-Year Perspectives -- Residential & Condos Combined -- Lapeer County Numbers
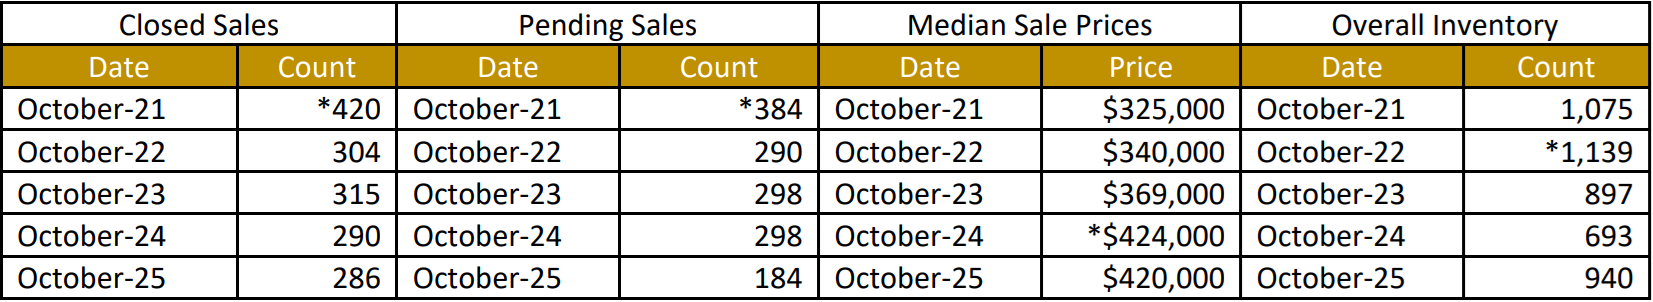
October 5-Year Perspectives -- Residential & Condos Combined -- Livingston County
October 5-Year Perspectives -- Residential & Condos Combined -- Macomb County Numbers
October 5-Year Perspectives -- Residential & Condos Combined -- Oakland County Numbers
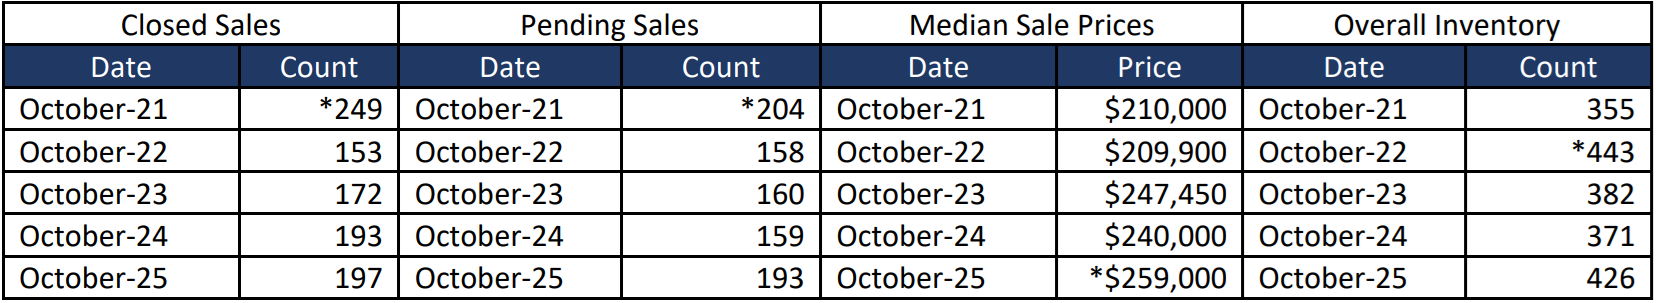
October 5-Year Perspectives -- Residential & Condos Combined -- St. Clair County Numbers
October 5-Year Perspectives -- Residential & Condos Combined -- Washtenaw County Numbers
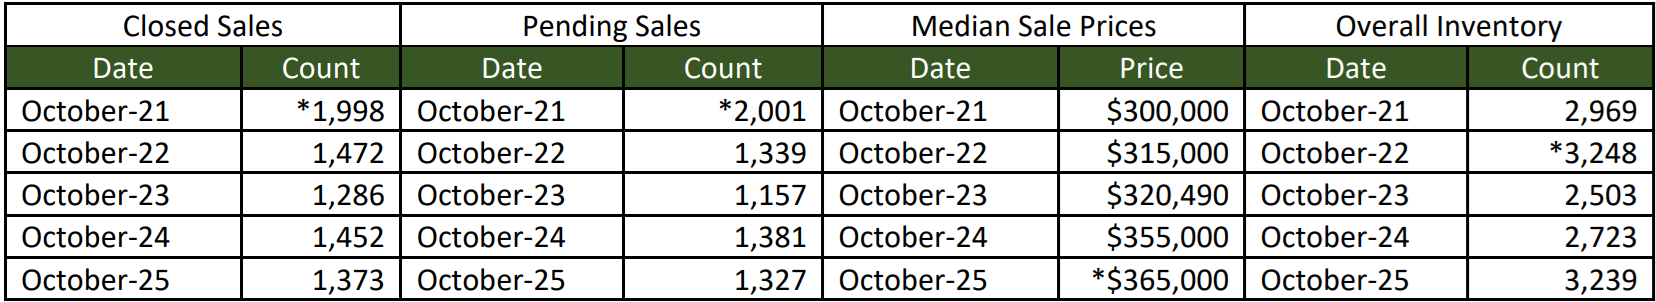
October 5-Year Perspectives -- Residential & Condos Combined -- Wayne County Numbers
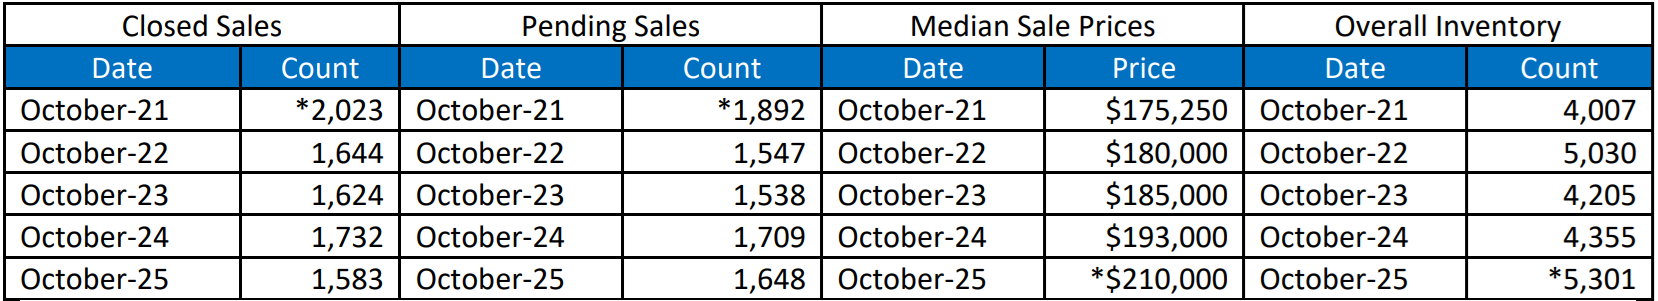
*high points noted with an asterisk.
Note: These numbers represent real estate market activity in the lower part of Michigan. Be sure to contact a REALTOR® for their expertise about local markets. Find a REALTOR® in your market at www.MoveInMichigan.com.
Realcomp Shareholder Boards & Associations of REALTORS®:
- DABOR, Andrea Kuentz, CEO, 313-278-2220
- DAR, Sharon Armour, EVP, 313-962-1313
- ETAR, Laura VanHouteghen, 810-982-6889
- GPBR, Bob Taylor, CEO, 313-882-8000
- LUTAR, 810-664-0271
- LCAR, Terri Fratarcangeli, EVP, 810-225-1100
- NOCBOR, Patricia Jacobs, EVP, 248-674-4080