Median Sales Prices Remain Strong in SeptemberInventory of Homes on Market Ticks Up
September – National Real Estate Commentary
The U.S. real estate market continues to slow as we move into fall, as rising consumer prices and higher mortgage interest rates squeeze homebuyer budgets and cool activity. With inflation showing little sign of abating, the Federal Reserve implemented another 75-basis-point hike in September, marking the third such rate increase this year. The cost of borrowing has reached multi-year highs on everything from credit cards to auto loans in 2022 as mortgage interest rates topped 6% for the first time since 2008, causing existing home sales to decline for the seventh consecutive month.
Closed Sales decreased 16.9 percent for Residential homes and 15.1 percent for Condo homes. Pending Sales decreased 23.1 percent for Residential homes and 16.8 percent for Condo homes. Inventory increased 3.4 percent for Residential homes but decreased 4.8 percent for Condo homes.
The Median Sales Price increased 3.8 percent to $244,000 for Residential homes and 7.3 percent to $234,000 for Condo homes. Days on Market increased 17.4 percent for Residential homes and 3.7 percent for Condo homes. Months-Supply of Inventory increased 10.5 percent for Residential homes but remained flat for Condo homes.
Affordability challenges have priced many buyers out of the market this year, and buyers who do succeed in purchasing a home are finding that the costs of homeownership have increased significantly, with monthly mortgage payments more than 55% higher than a year ago, according to the National Association of REALTORS®. Inventory remains lower than normal, and as the market continues to shift, experts project homes will begin to spend more days on market and price growth will slow in the months ahead.
September Y-O-Y Comparison -- Residential & Condos Combined -- All MLS
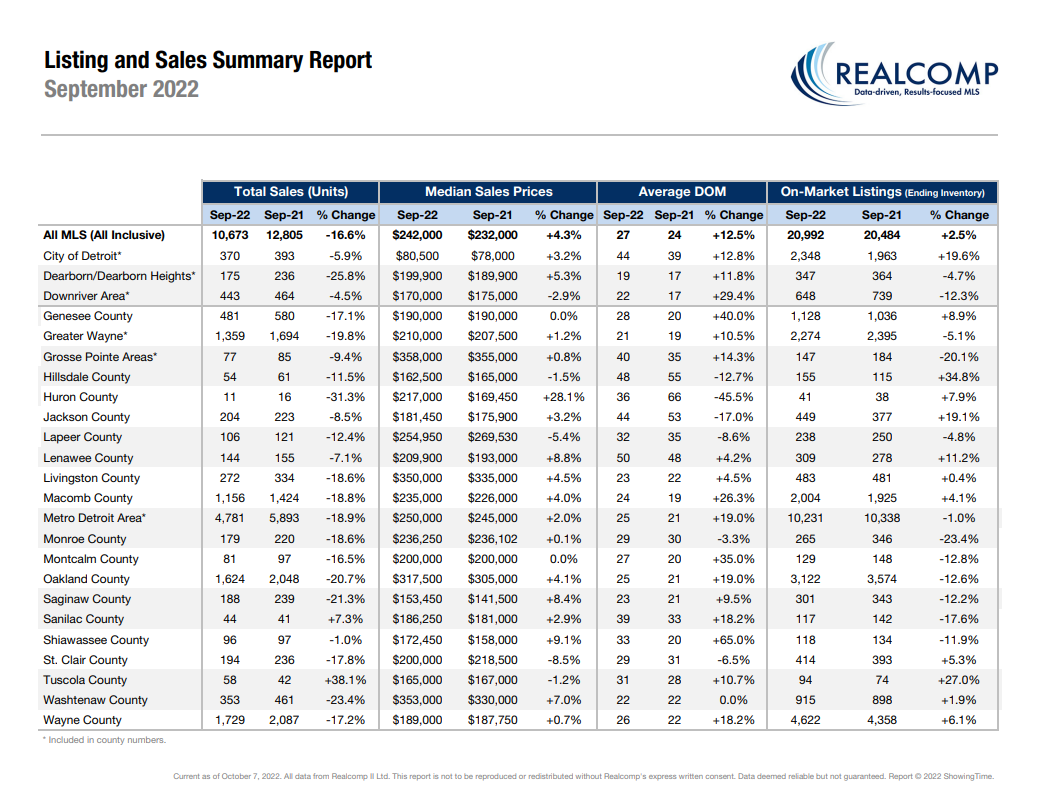
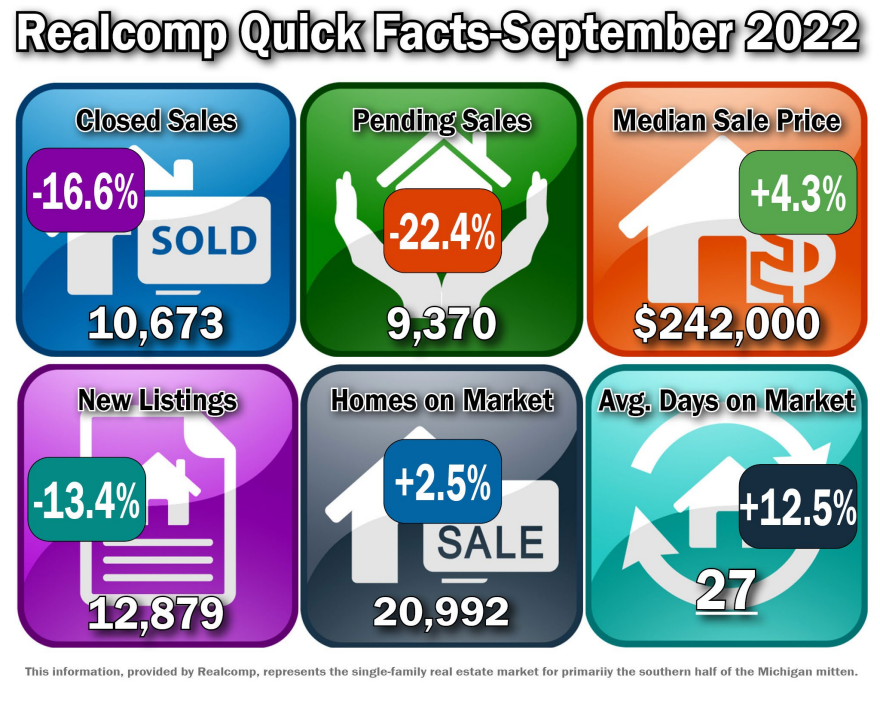
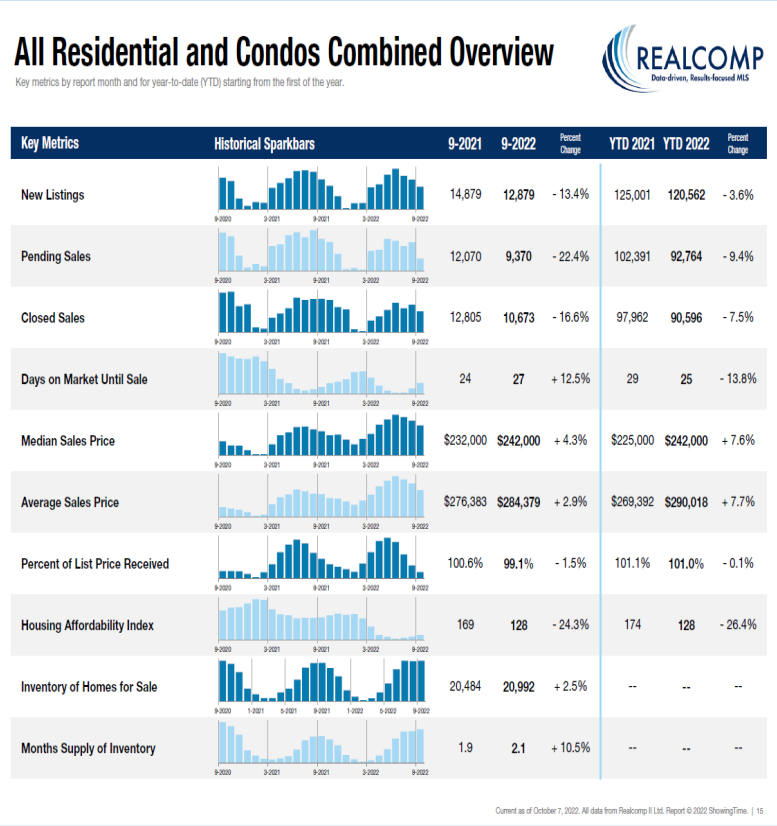
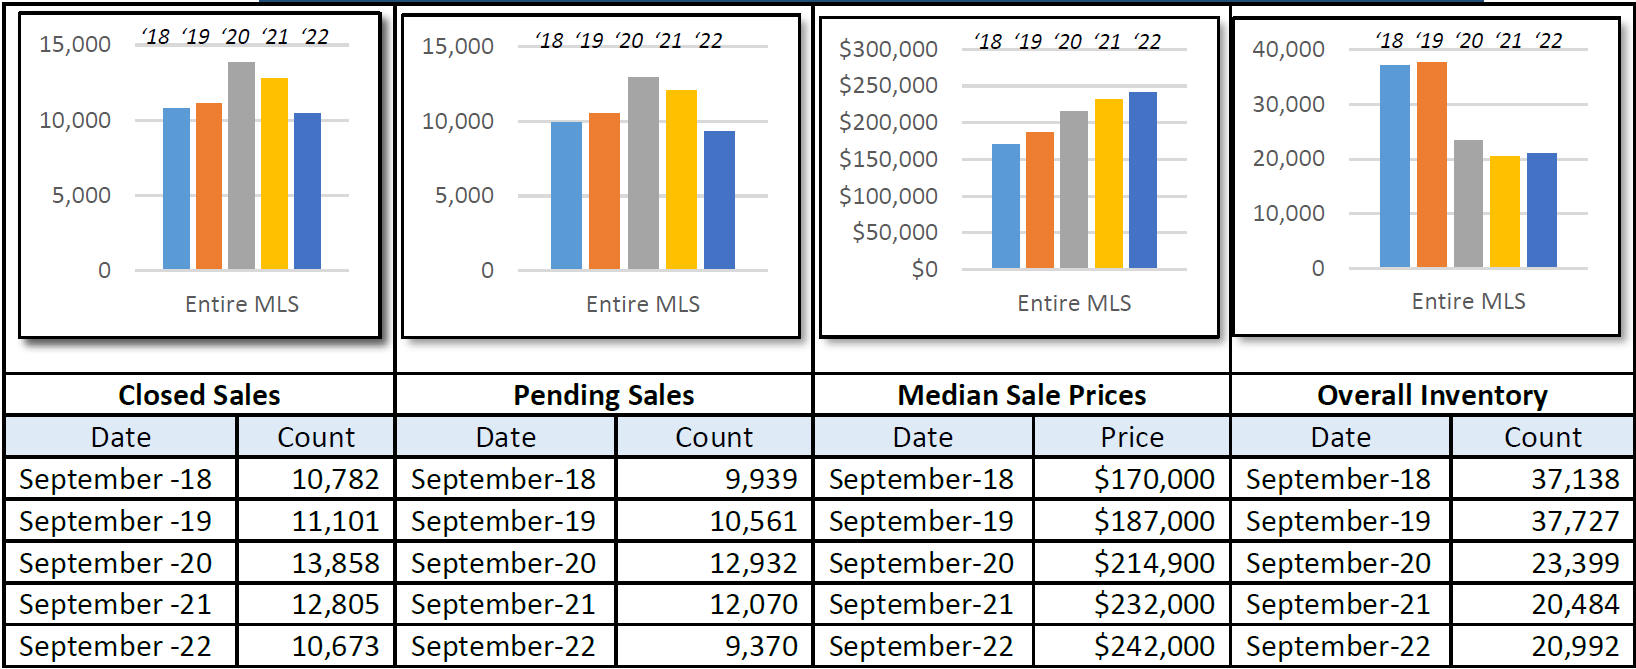
Median Sales Price increased by 4.3% from $232,000 to $242,000.
The average days on market (DOM) increased by 3 days from 24 to 27.
The average % of the last list price received decreased by 1.5% from 100.6% to 99.1%.
New Listings decreased by 13.4% from 14,879 to 12,879.
Average Showings per Home decreased by 2.2 from 9.5 to 7.3.
Pending Sales decreased by 22.4% from 12,070 to 9,370.
Closed Sales decreased by 16.6% from 12,805 to 10,673.
Listings that were both listed and pended in the same month were at 3,893. This represents 30.2% of the new listings for the month and 41.5% of the pended listings.
Months-Supply of Inventory increased by 10.5% from 1.9 to 2.1.
September – Activity by Region or County
The Median Sale Price for the Metro Detroit area (Livingston, Macomb, Oakland, & Wayne combined) increased to $250,000, up by 2% over last September, based on 4,781 sales. Listings spent an average of 25 days on the market, up 4 days compared to last September.
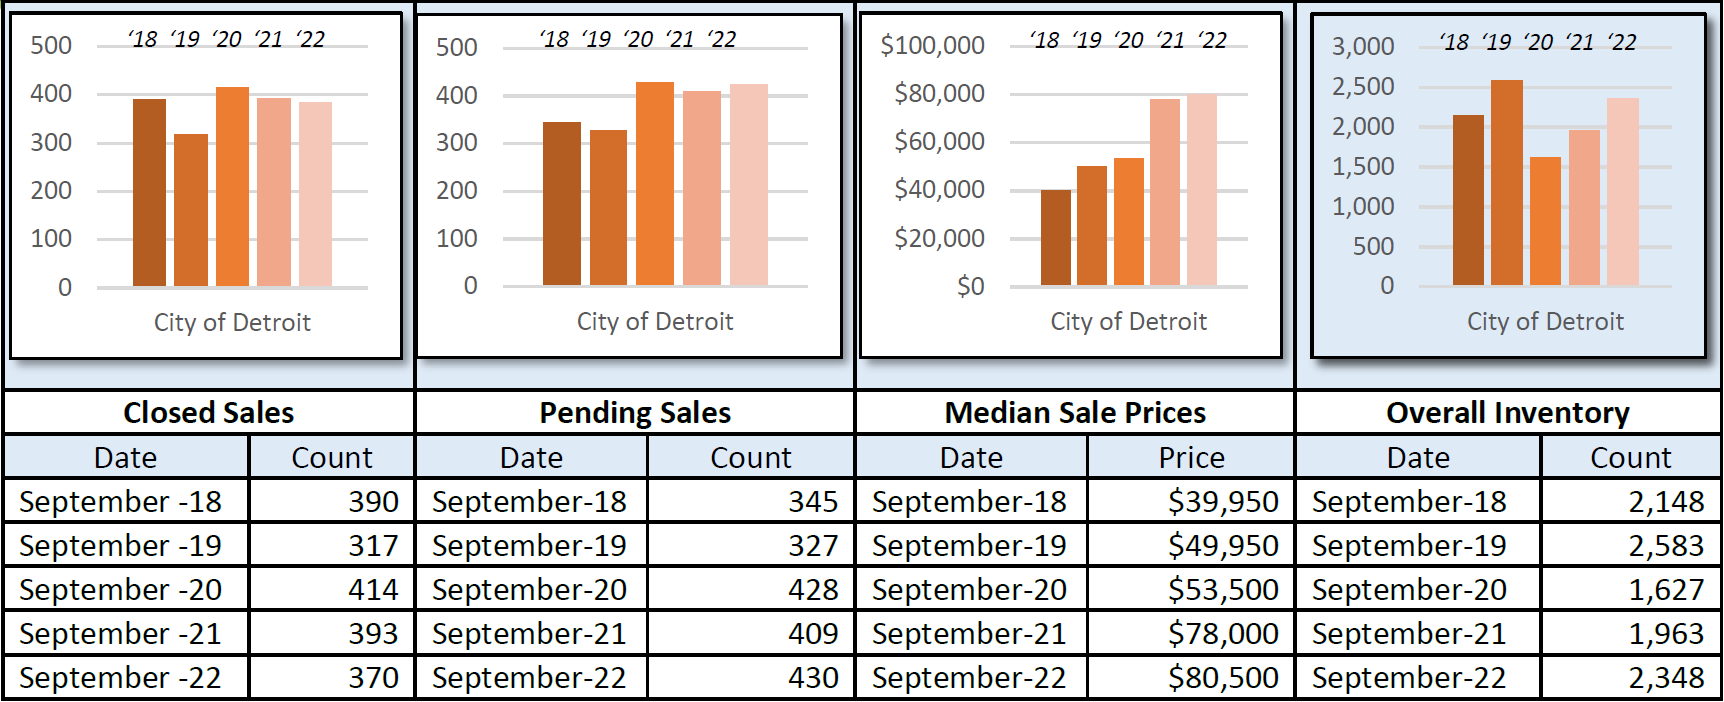
The Median Sale Price for the City of Detroit increased to $80,500, up by 3.2% over last September, based on 370 sales. Listings spent an average of 44 days on the market, up from 39 days compared to last September.
The Median Sale Price for Lapeer County decreased to $254,950, down by 5.4% over last September, based on 106 sales. Listings spent an average of 32 days on the market, down 3 days compared to last September.
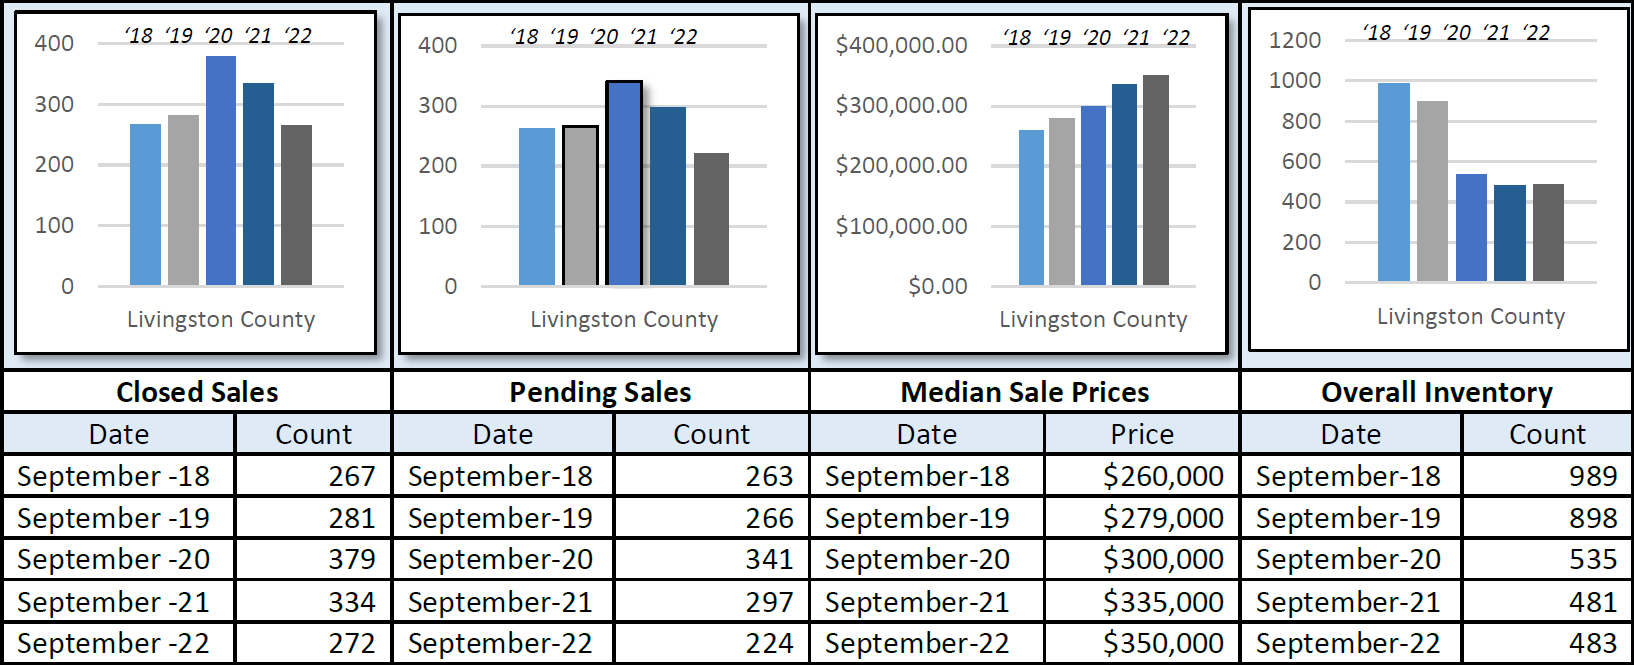
The Median Sale Price for Livingston County increased to $350,000, up by 4.5% over last September, based on 272 sales. Listings spent an average of 23 days on the market, up 1 day compared to last September.
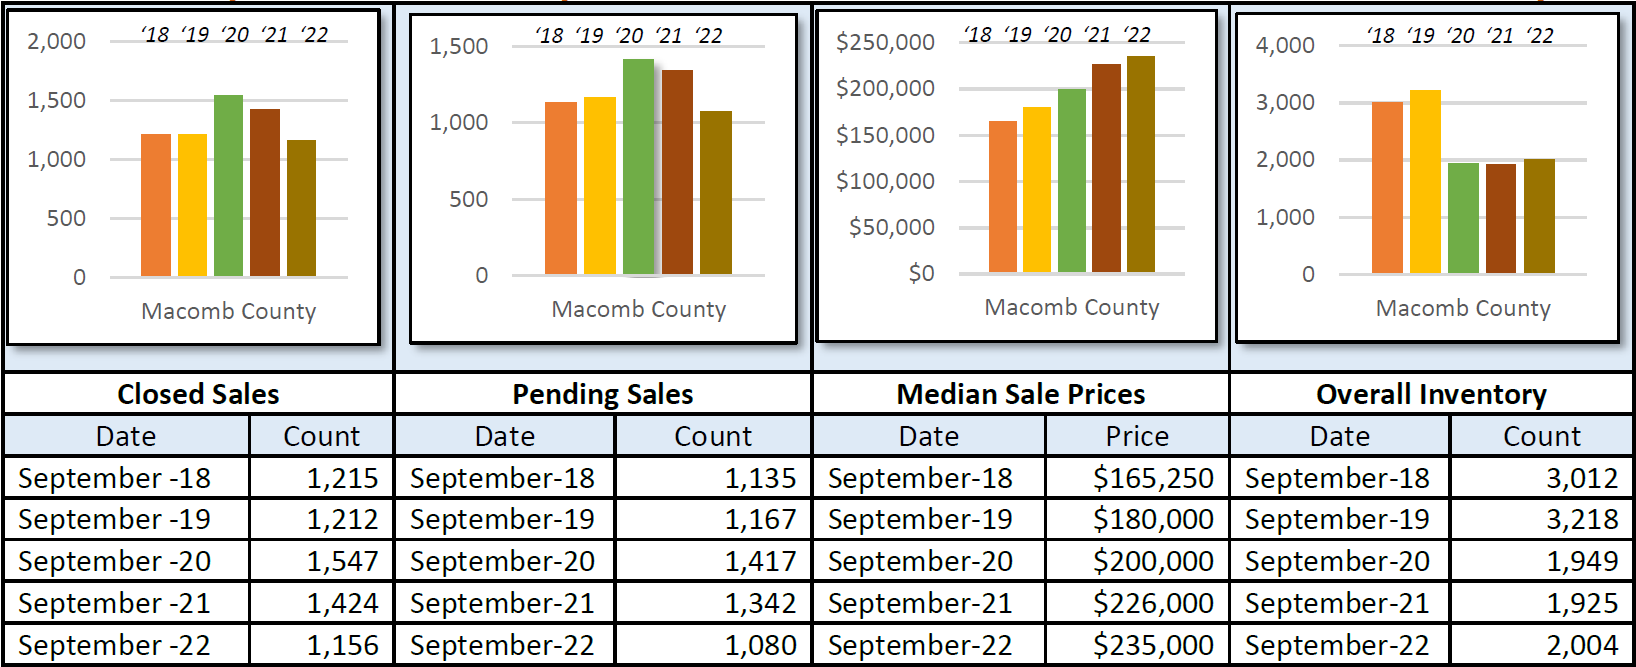
The Median Sale Price for Macomb County increased to $235,000, up by 4% over last September, based on 1,156 sales. Listings spent an average of 24 days on the market, up 5 days compared to last September.
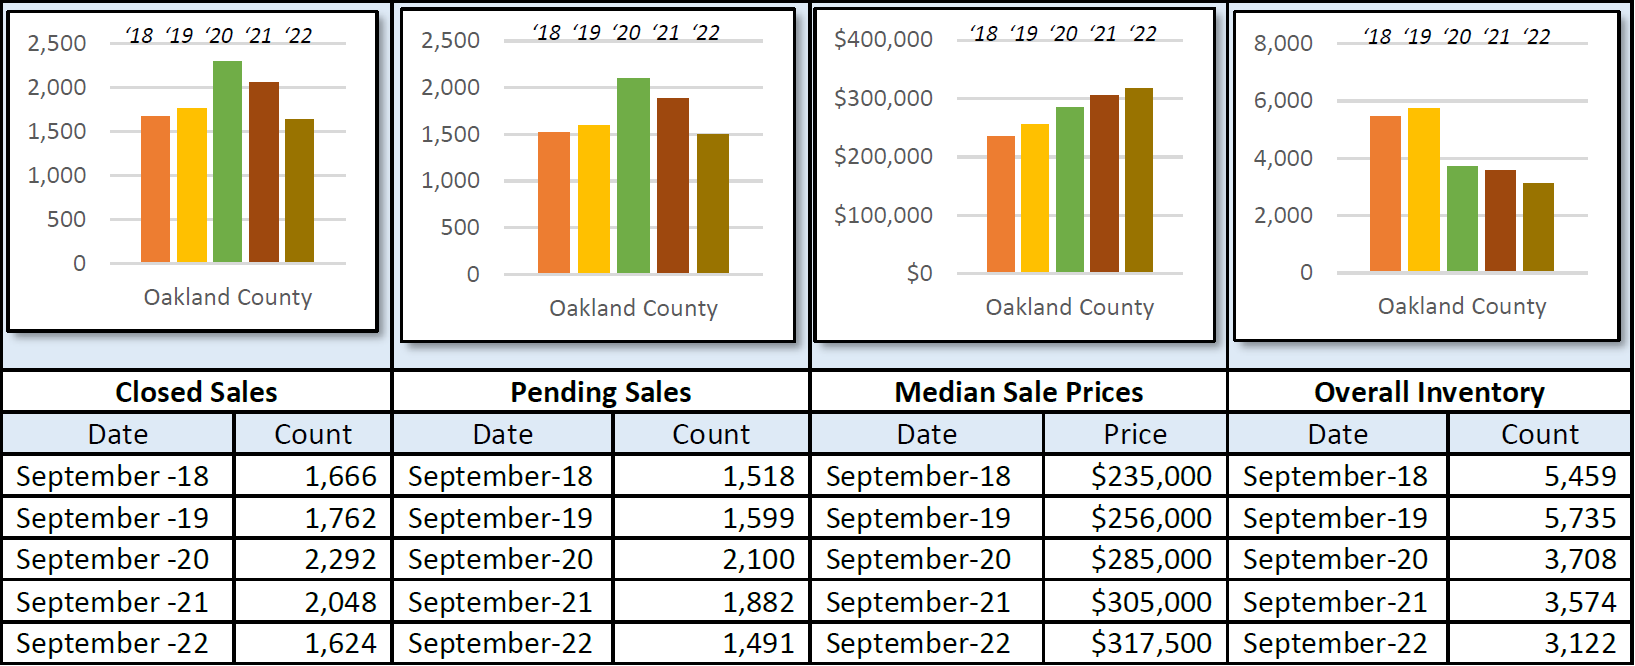
The Median Sale Price for Oakland County increased to $317,500, up by 4.1% over last September, based on 1,624 sales. Listings spent an average of 25 days on the market, up 4 days compared to last September.
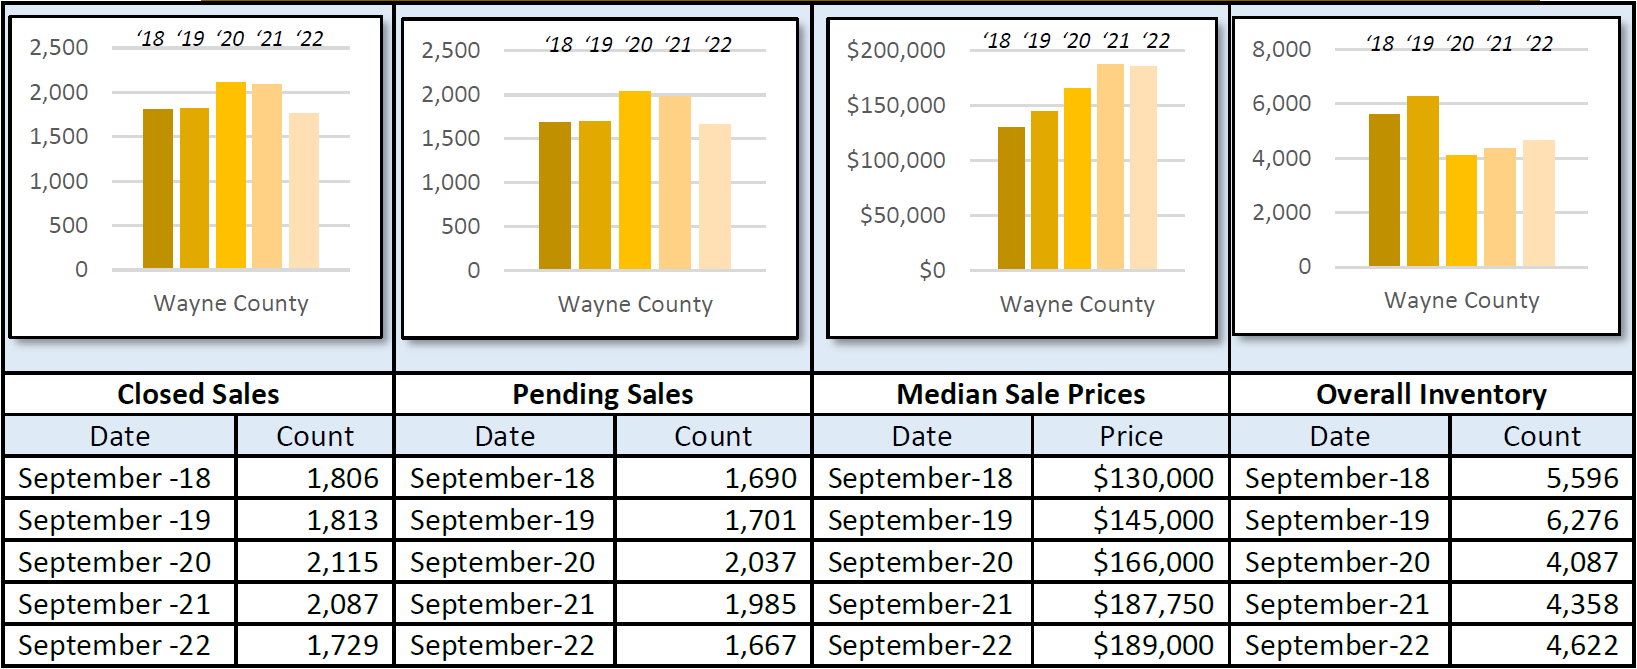
The Median Sale Price for Wayne County increased to $189,000, up by .7% over last September, based on 1,729 sales. Listings spent an average of 26 days on the market, up 4 days compared to last September.
September 5-Year Perspectives -- Residential & Condos Combined -- All MLS
September 5-Year Perspectives -- Residential & Condos Combined -- Livingston County
September 5-Year Perspectives -- Residential & Condos Combined -- Macomb County Numbers
September 5-Year Perspectives -- Residential & Condos Combined -- Oakland County Numbers
September 5-Year Perspectives -- Residential & Condos Combined -- Wayne County Numbers
September 5-Year Perspectives -- Residential & Condos Combined – City of Detroit Numbers
It’s important to note that these numbers present a high level view of what is happening in the real estate market in the lower part of Michigan and in specific regions. Be sure to contact a REALTOR® for their expertise about local markets.
Realcomp Shareholder Boards & Associations of REALTORS®:
- DABOR, 313-278-2220
- DAR, Sharon Armour, EVP, 313-962-1313
- ETAR, Laura VanHouteghen, 810-982-6889
- GMAR, Vickey Livernois, EVP, 248-478-1700
- GPBR, Bob Taylor, CEO, 313-882-8000
- LUTAR, 810-664-0271
- LCAR, Pam Leach, EVP, 810-225-1100
- NOCBOR, Patricia Jacobs, EVP, 248-674-4080