Across the country, Americans are struggling with housing affordability. As home prices and interest rates continue to rise, homeownership may seem more out of reach than ever.
Last year, we ran the numbers on the costs of homeownership and found that in 17 of the 33 largest metropolitan statistical areas (MSAs), owning a home was cheaper than renting.
This year, we did the math again. The cost of homeownership has been rising over the past 12 months, reflecting both higher home prices and mortgage rates. But rents have been rising as well, especially in the 33 MSAs we examined.
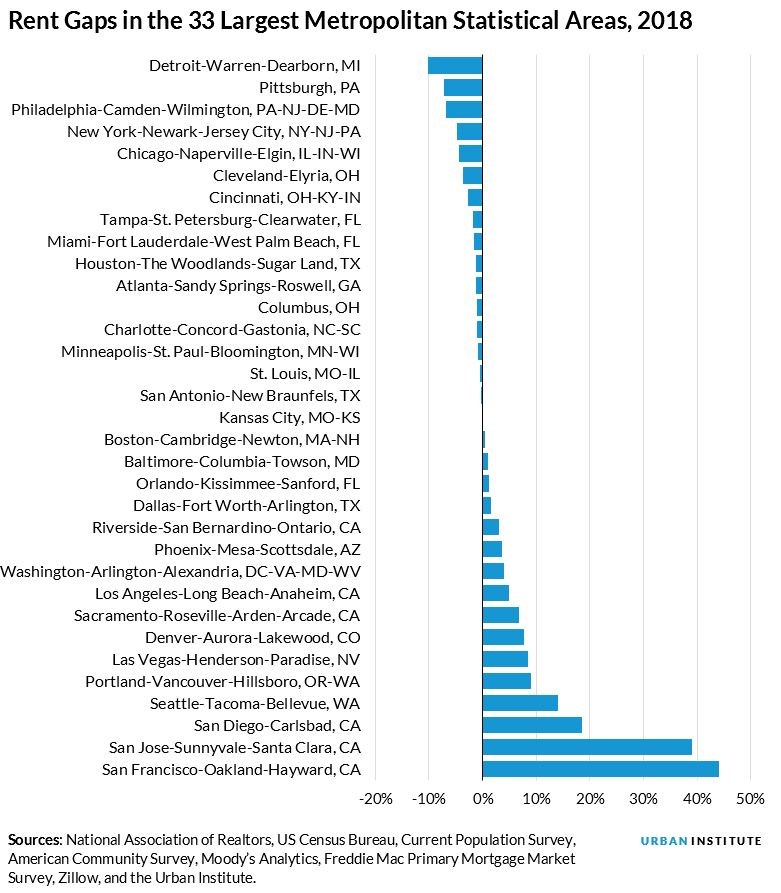
This year, there are again 17 cities where it is cheaper to own a home than to rent, but some of these cities have traded places with others, while others’ rent gaps have grown significantly.

Click here to download the data.
What Changed?
Not surprisingly, expensive West Coast cities such as San Francisco, San Jose, and Seattle still top the list of cities where renting is significantly cheaper than owning. This is an ongoing symptom of the supply shortage and surge in housing demand.
But several cities are showing more extreme rent gaps than last year: San Jose saw the rent gap grow by 20 percent, and San Diego’s rent gap grew by nearly 12 percent. That is, in San Jose, relative to the median rent, the mortgage payment on the median home would now require an additional 20 percent of the median family income, courtesy of robust home price appreciation and higher mortgage rates.
On the other end of the spectrum, homeownership is an increasingly good deal in some cities, including Detroit, New York City, Philadelphia, and Pittsburgh. In Pittsburgh last year, the mortgage payment on the median-priced home would have consumed 16 percent of the median family’s income, while the median rent would have taken 21 percent.
This year, the share of income devoted to a mortgage decreased to 14 percent (thanks to a dip in home prices and rising incomes), while rents stayed consistent, making homeownership relatively more affordable than renting. The rent gap in Pittsburgh now stands at 7 percent.
Boston, Minneapolis, Orlando, and St. Louis landed on the opposite side of the calculation from last year. For three of these cities, the rent gap was close to zero in both years, so the changes are marginal.
Orlando provides an interesting case study because the city flipped from one where homeownership is more affordable to one where renting is more affordable. In 2017, Orlando had a negative rent gap of 3 percent, with median rent consuming 3 percent more of the median income than homeownership. This year, the city had a positive rent gap of about 1 percent, a sign that home price increases have outpaced rent increases.
How can we support homeownership?
Regardless of whether it’s cheaper than renting, homeownership still has significant financial benefits and is the primary tool most families use to build wealth.
Today, we published an updated and expanded version of our barriers to homeownership report, which provides data on three significant barriers to homeownership: affordability, accruing an adequate down payment, and accessing mortgage credit.
The report reveals how little most people know about down payments. (Test your own knowledge with our new down payments quiz.) Most striking is that most potential homebuyers are largely unaware that there are low– and no–down payment assistance programs available to help them secure an affordable down payment. And too few know how big a down payment is actually needed to buy a home in the US today.
Our interactive map also illuminates barriers to homeownership. By learning and talking about these issues, we can help break down barriers to the financial benefits of owning a home.