Median Sales Prices Continue their Jump in JulyDetroit Leads Way - Up Over 40% to $100,000
July – National Real Estate Commentary
The U.S. housing market has continued to cool, as rising mortgage rates and record-high sales prices have stifled affordability, weakening demand and pricing out a multitude of buyers. Nationally, median household income has failed to keep pace with increasing mortgage payments, with the costs of buying a home about 80% more expensive now than they were just three summers ago, according to the National Association of REALTORS® (NAR). As more and more prospective buyers find their home purchase plans delayed, many are turning to the rental market, where competition has intensified due to increased demand.
Closed Sales decreased 15.7 percent for Residential homes and 13.6 percent for Condo homes. Pending Sales decreased 14.4 percent for Residential homes and 6.4 percent for Condo homes. Inventory increased 9.6 percent for Residential homes but decreased 7.9 percent for Condo homes.
The Median Sales Price increased 7.9 percent to $260,000 for Residential homes and 11.0 percent to $244,105 for Condo homes. Days on Market decreased 5.0 percent for Residential homes and 18.5 percent for Condo homes. Months-Supply of Inventory increased 17.6 percent for Residential homes but remained flat for Condo homes.
At a time of year when homebuying activity is typically very strong, soaring homeownership costs have caused home sales to decline nationwide for the fifth consecutive month, with existing-home sales falling 5.4% monthto-month and 14.2% year-over-year as of last measure, according to NAR. But there is a bright spot. Inventory of existing homes has continued to climb this summer, with 1.26 million homes available at the beginning of July, equivalent to a 3 months’ supply. And despite the summer slowdown, homes are still selling quickly, with the typical home staying on market an average of 14 days.
July Y-O-Y Comparison -- Residential & Condos Combined -- All MLS
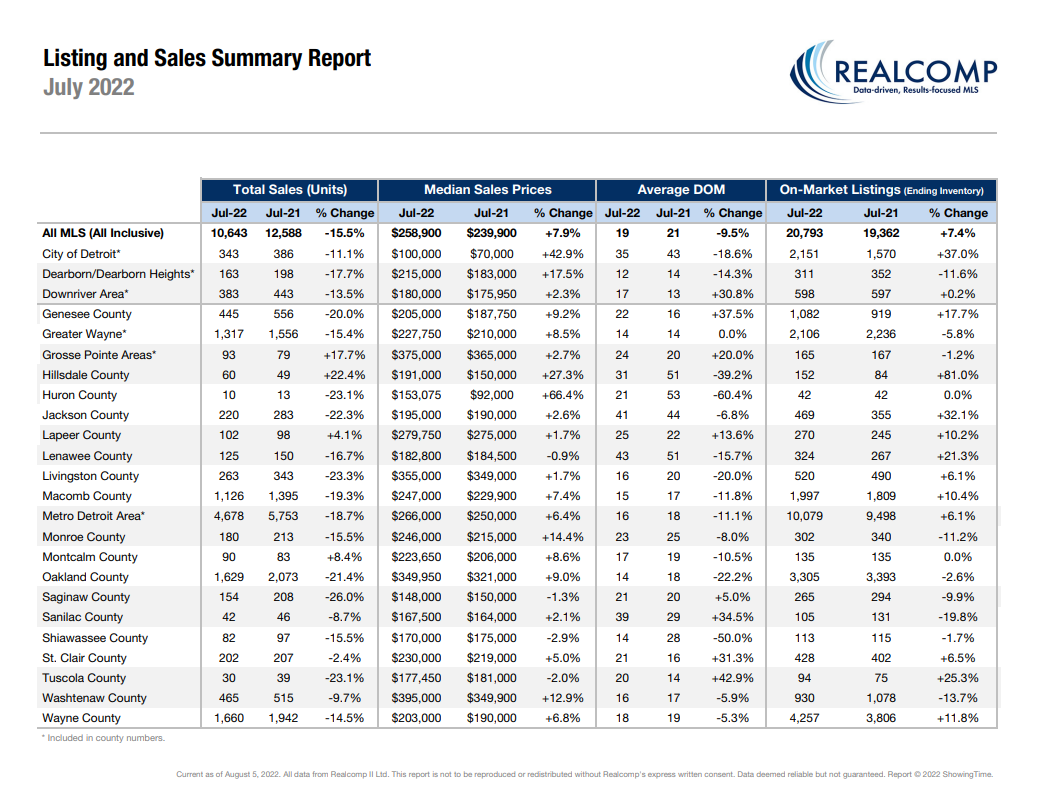
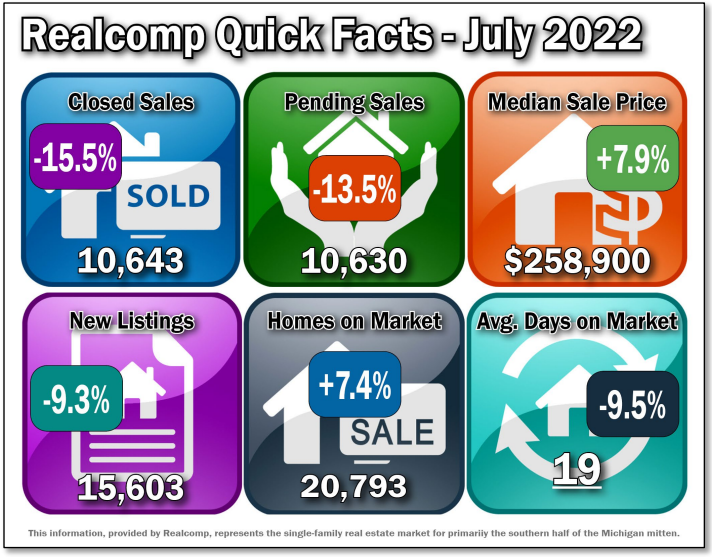
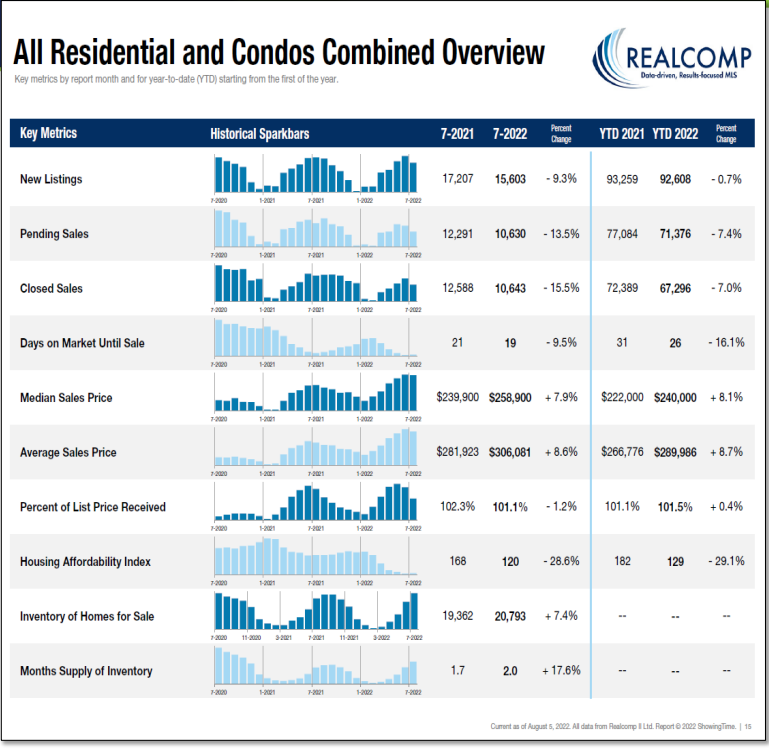
Median Sale Price increased by 7.9% from $239,900 to $258,900.
The average days on market (DOM) decreased by 9.5% from 21 to 19 days.
The average % of the last list price received decreased by 1.2% from 102.3% to 101.1%.
New Listings decreased by 9.3% from 17,207 to 15,603.
Average Showings per Home decreased by 3.3 from 11.5 to 8.2.
Pending Sales decreased by 13.5% from 12,291 to 10,630.
Closed Sales decreased by 15.5% from 12,588 to 10,643.
Listings that were both listed and pended in the same month were at 5,385. This represents 34.5% of the new listings for the month and 50.66% of the pended listings.
Months-Supply of Inventory increased by 17.6% from 1.7 to 2.0.
July – Activity by Region or County
The Median Sale Price for the Metro Detroit area (Livingston, Macomb, Oakland, & Wayne combined) increased to $266,000, up by 6.4% over last July, based on 4,678 sales. Listings spent an average of 16 days on the market, down 2 days compared to last July.
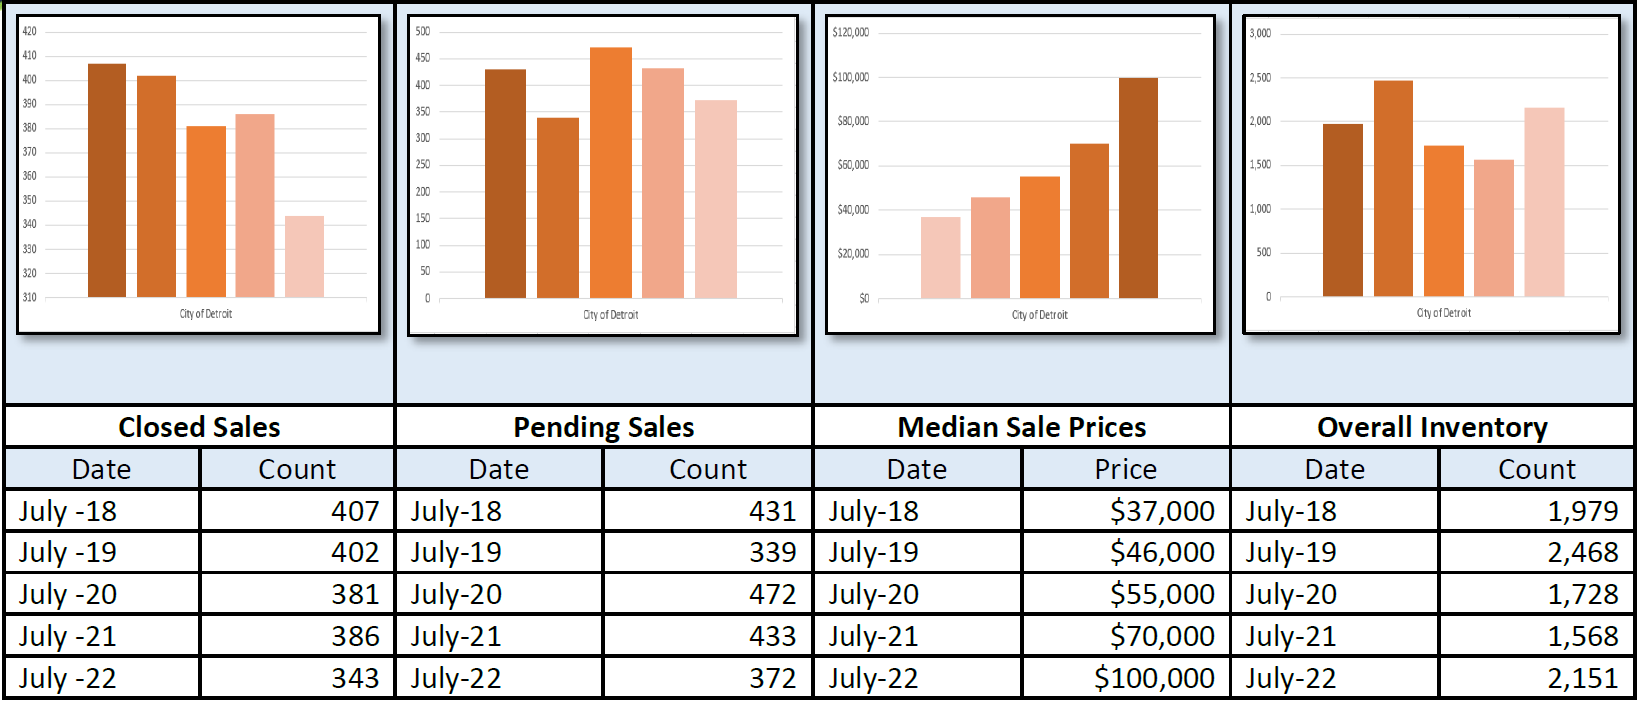
The Median Sale Price for the City of Detroit increased to $100,000, up by 42.9% over last July, based on 343 sales. Listings spent an average of 35 days on the market, down 8 days compared to last July.
• The Median Sale Price for Lapeer County increased to $279,750, up by 1.7% over last July, based on 102 sales. Listings spent an average of 25 days on the market, up 3 days compared to last July.
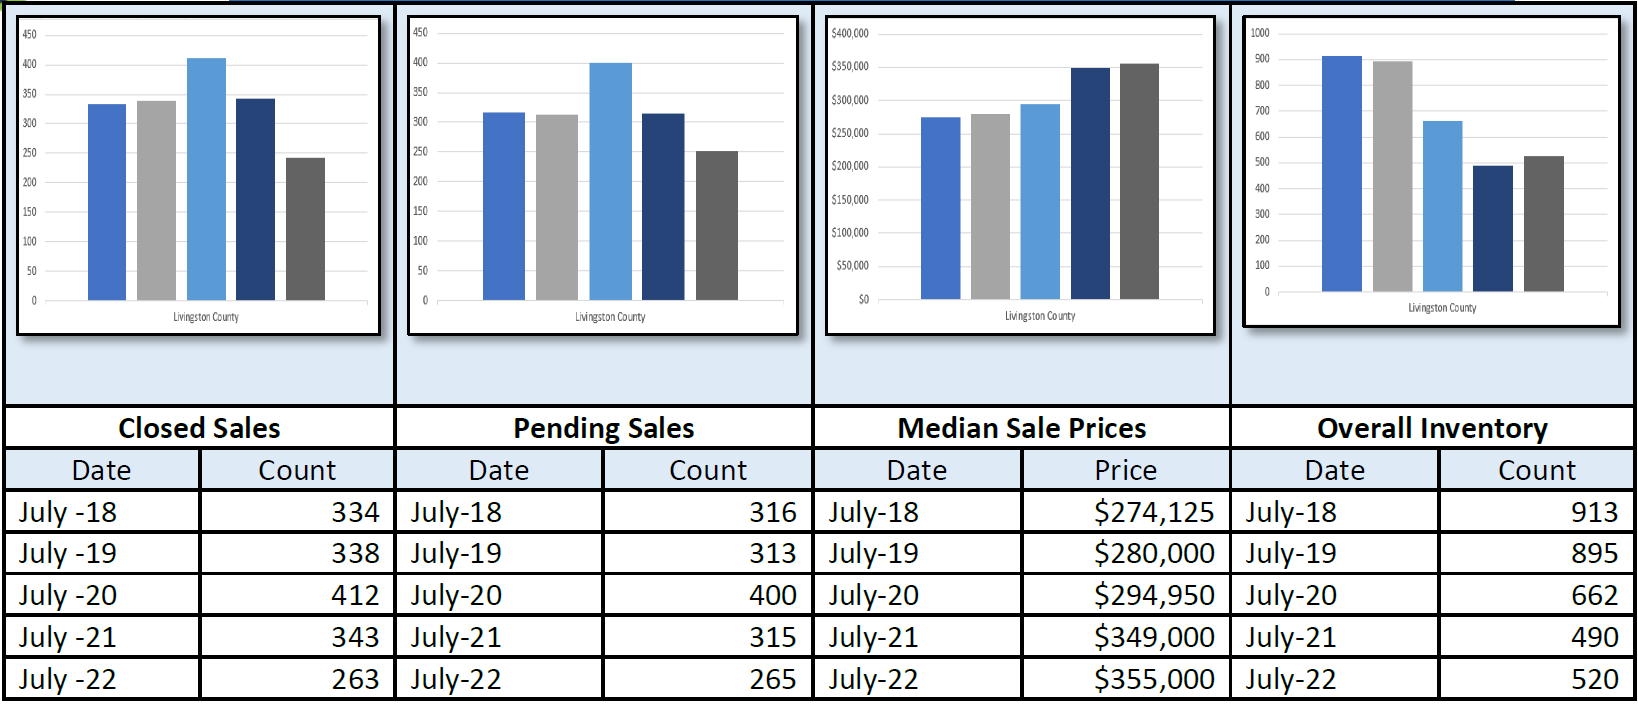
The Median Sale Price for Livingston County increased to $355,000, up by 1.7% over last July, based on 263 sales. Listings spent an average of 16 days on the market, down 4 days compared to last July.
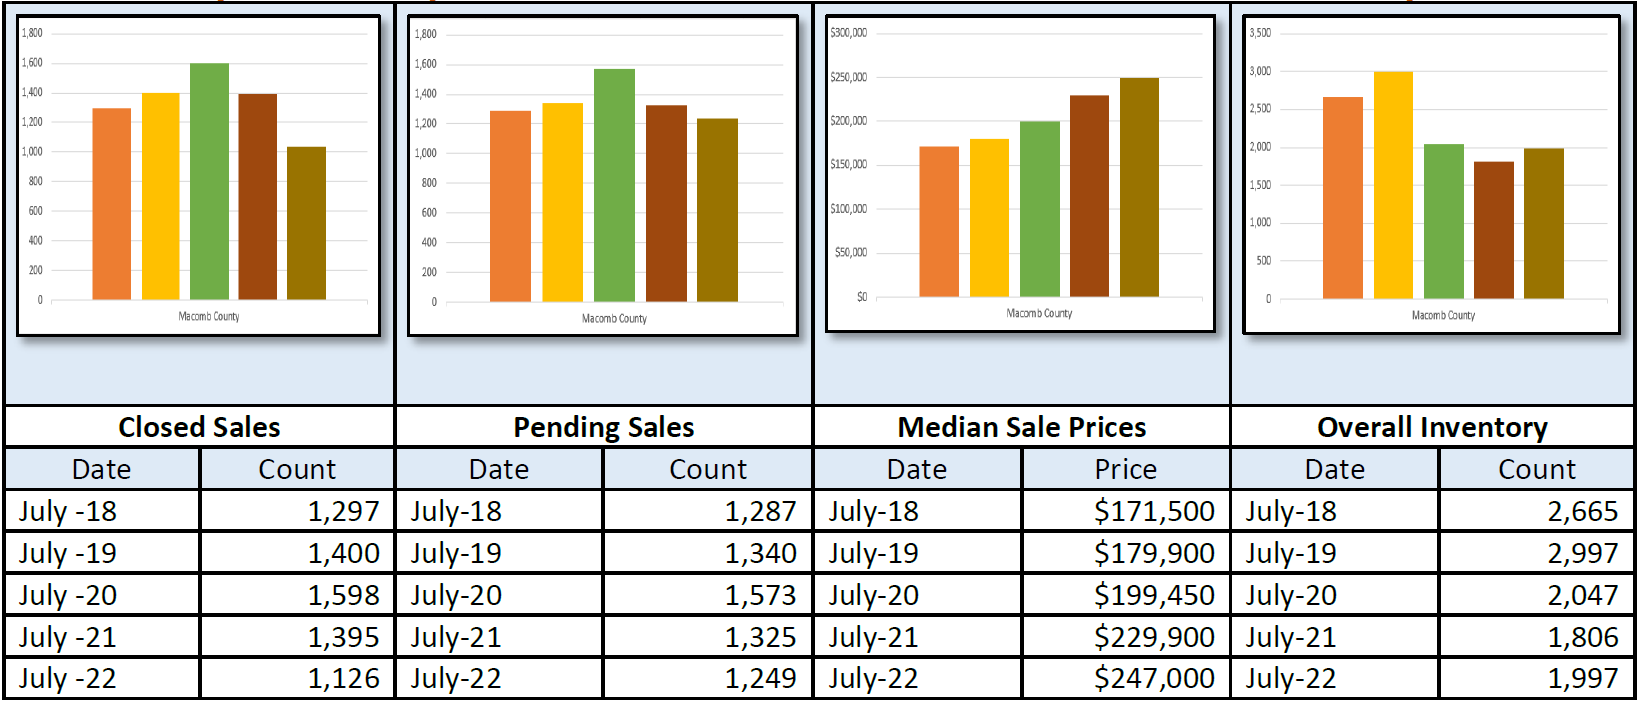
The Median Sale Price for Macomb County increased to $247,000, up by 7.4% over last July, based on 1,126 sales. Listings spent an average of 15 days on the market, down 2 days compared to last July.
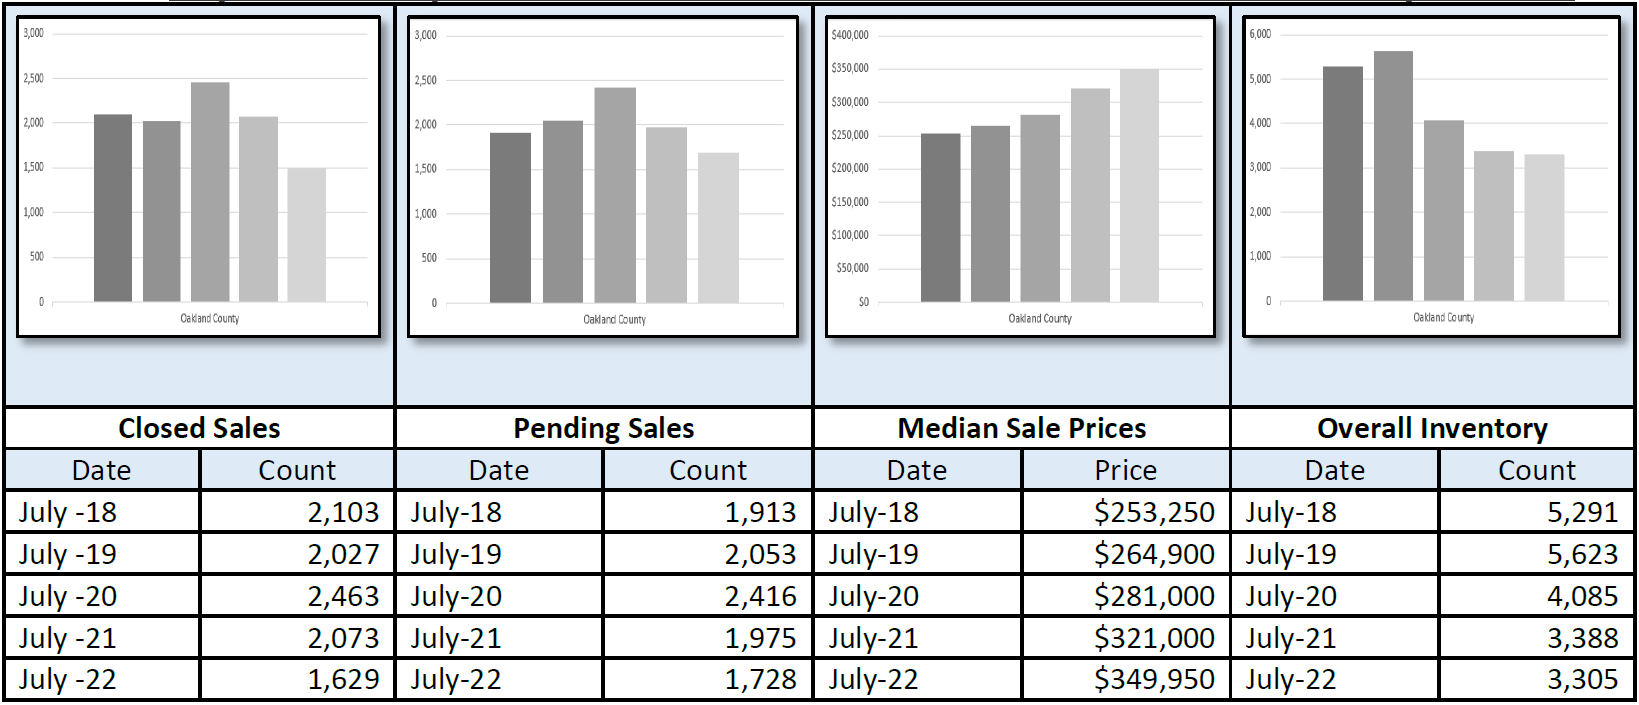
The Median Sale Price for Oakland County increased to $349,950, up by 9% over last July, based on 1,629 sales. Listings spent an average of 14 days on the market, down 4 days compared to last July.
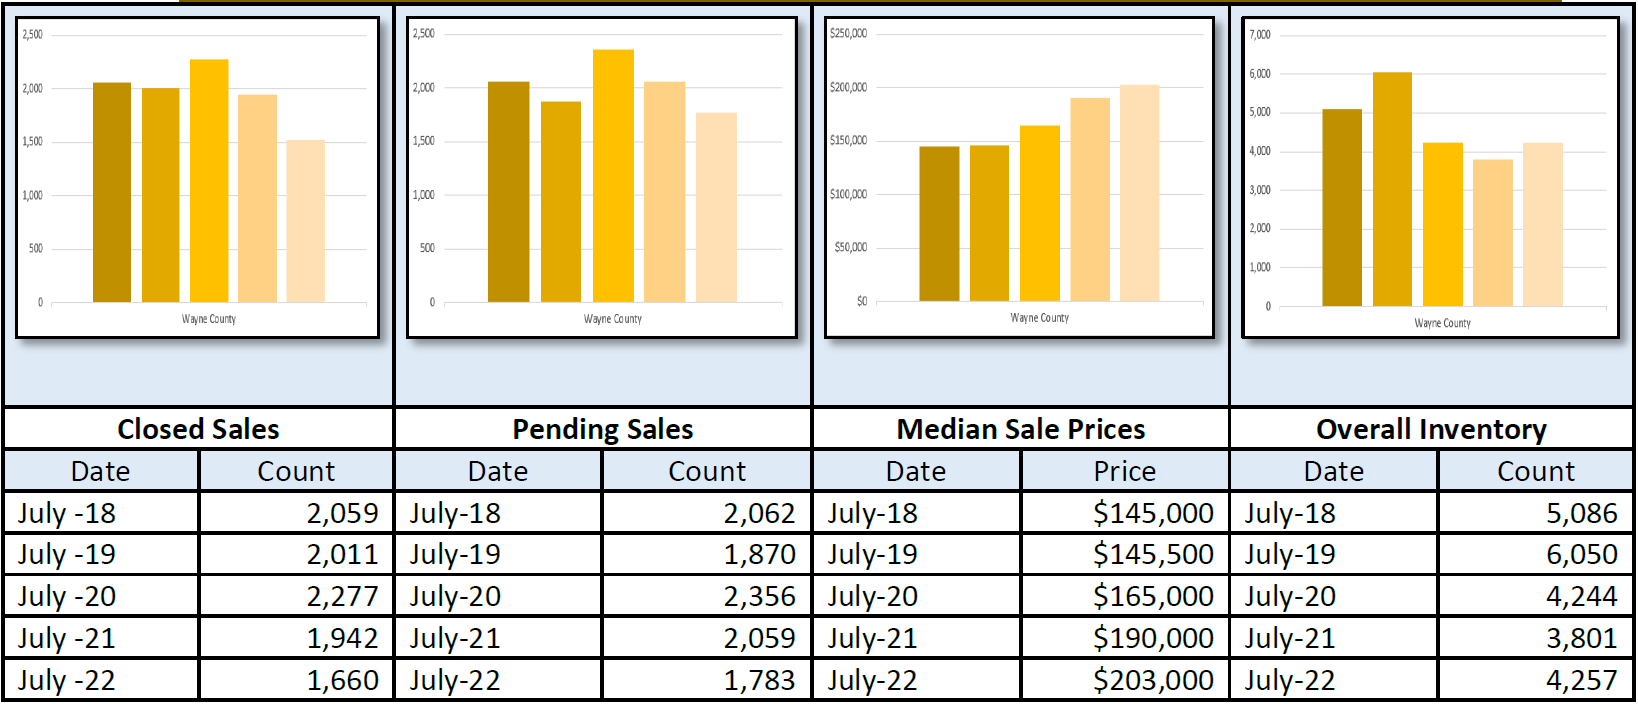
The Median Sale Price for Wayne County increased to $203,000, up by 6.8% over last July, based on 1,660 sales. Listings spent an average of 18 days on the market, down 1 day compared to last July.
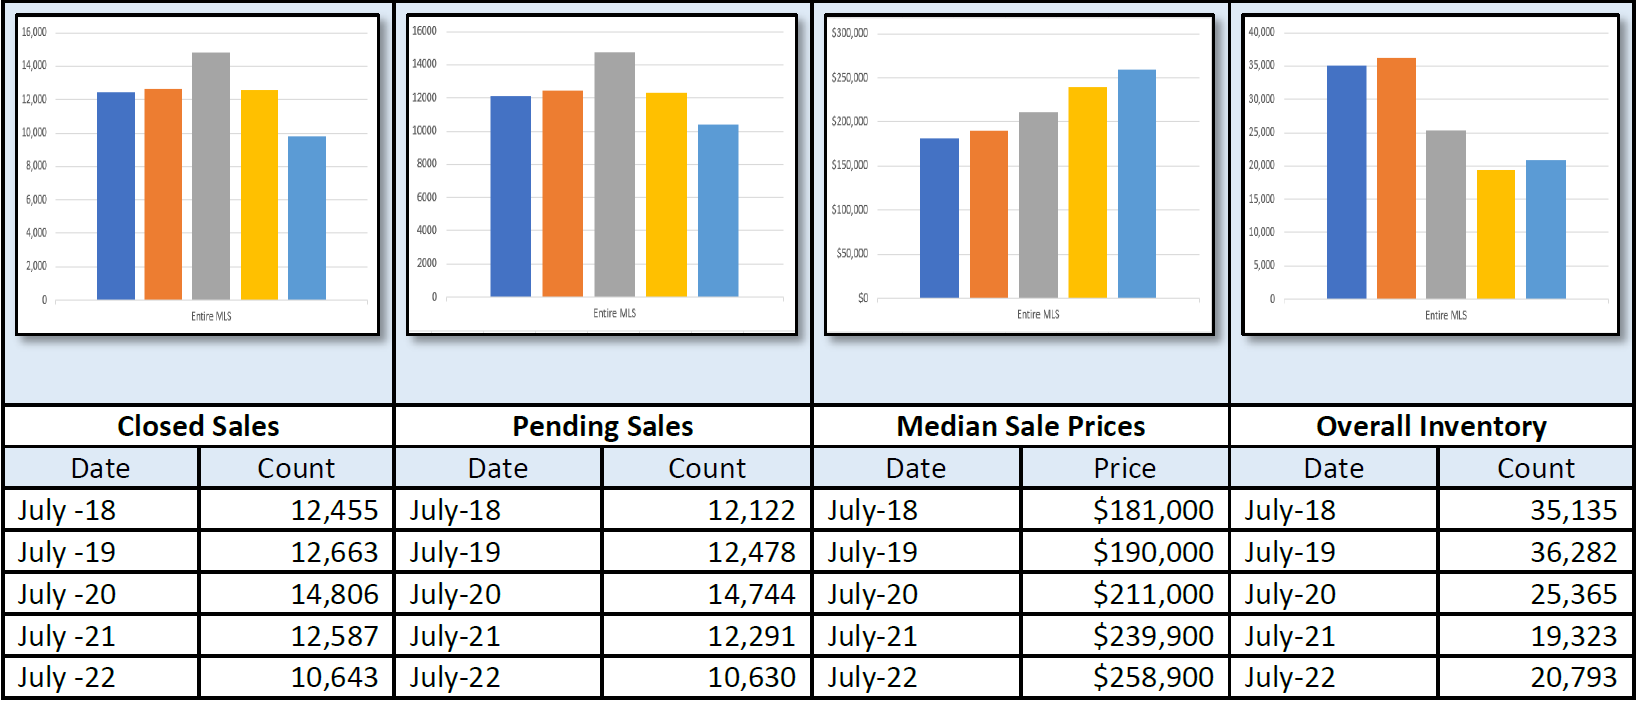
July 5-Year Perspectives -- Residential & Condos Combined -- All MLS
July 5-Year Perspectives -- Residential & Condos Combined -- Livingston County
July 5-Year Perspectives -- Residential & Condos Combined -- Macomb County Numbers
July 5-Year Perspectives -- Residential & Condos Combined -- Oakland County Numbers
July 5-Year Perspectives -- Residential & Condos Combined -- Wayne County Numbers
July 5-Year Perspectives -- Residential & Condos Combined – City of Detroit Numbers
It’s important to note that these numbers present a high level view of what is happening in the real estate market in the lower part of Michigan and in specific regions. Be sure to contact a REALTOR® for their expertise about local markets.
Realcomp Shareholder Boards & Associations of REALTORS®:
- DABOR, 313-278-2220
- DAR, Sharon Armour, EVP, 313-962-1313
- ETAR, Laura VanHouteghen, 8010-982-6889
- GMAR, Vickey Livernois, EVP, 248-478-1700
- GPBR, Bob Taylor, CEO, 313-882-8000
- LUTAR, 810-664-0271
- LCAR, Pam Leach, EVP, 810-225-1100
- NOCBOR, Patricia Jacobs, EVP, 248-674-4080