Market Calms Yet Remains RobustInventory Up 11% Median Sales Price Slight Uptick
August – National Real Estate Commentary
Summer 2022 has been a season of change for the U.S. real estate market. With housing affordability at a 33- year low, existing-home sales have continued to soften nationwide, falling 5.9% month-to-month and 20.9% year-over-year as of last measure, according to the National Association of REALTORS® (NAR). Pending home sales have also continued to decline, while new listings have steadily increased, with unsold inventory reaching 3.3 months’ supply at the start of August. The pullback in demand has been particularly hard on homebuilders, causing new-home sales and construction to slow.
Closed Sales decreased 11.4 percent for Residential homes and 7.1 percent for Condo homes. Pending Sales decreased 15.2 percent for Residential homes and 12.5 percent for Condo homes. Inventory increased 3.9 percent for Residential homes but decreased 7.1 percent for Condo homes.
The Median Sales Price increased 5.8 percent to $251,300 for Residential homes and 10.7 percent to $232,564 for Condo homes. Days on Market increased 4.8 percent for Residential homes but decreased 14.3 percent for Condo homes. Months Supply of Inventory increased 11.1 percent for Residential homes but remained flat for Condo homes.
Inflation, higher interest rates, and fears of a potential recession have taken a toll on buyers and sellers this summer, leading many people to stay on the sidelines to see what will happen with the market. But some experts, including NAR Chief Economist Lawrence Yun, believe the worst of inflation may be over. Although sales prices remain up from this time last year, price growth is expected to moderate in the months ahead as the market continues to shift in a more buyer-friendly direction.
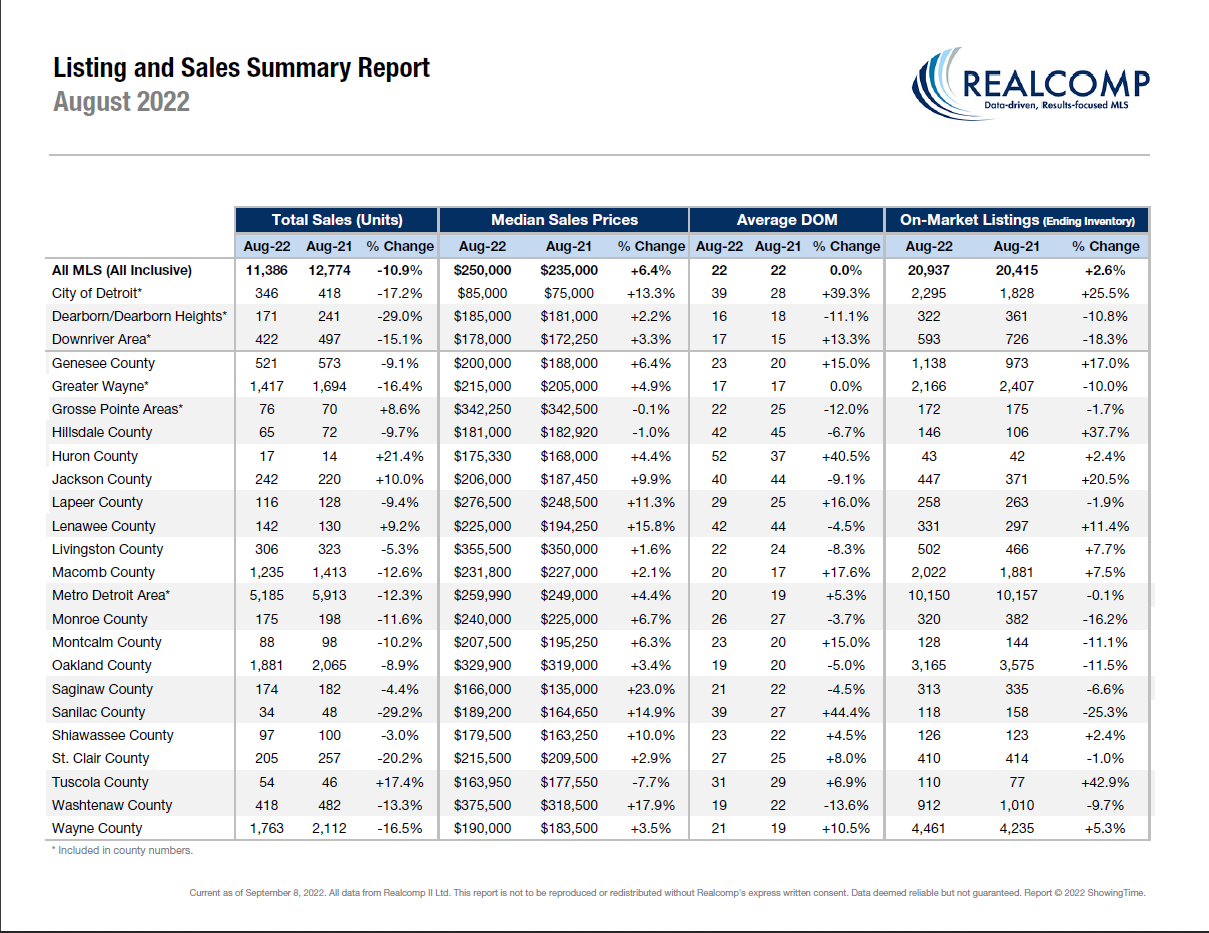
August Y-O-Y Comparison -- Residential & Condos Combined -- All MLS
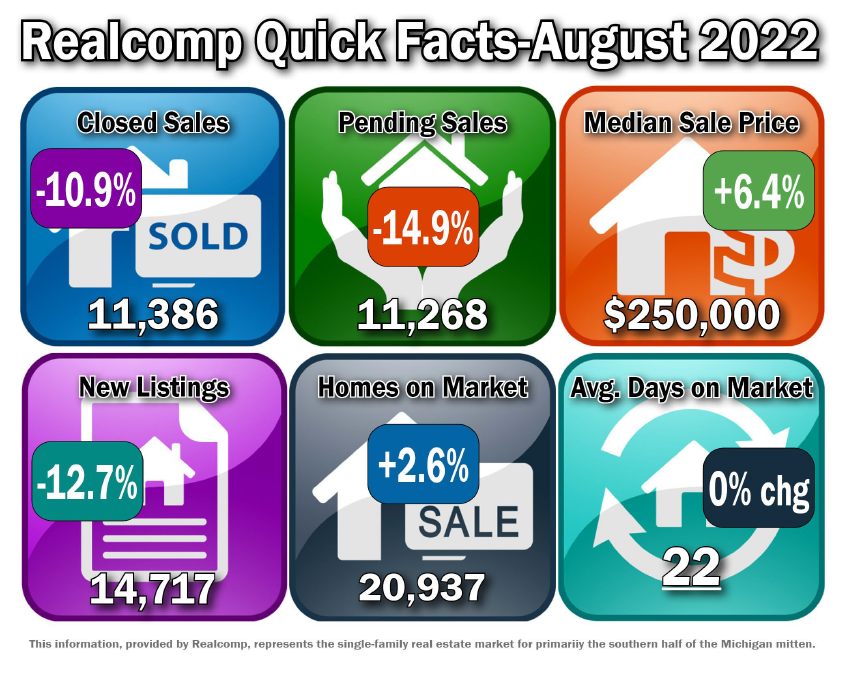
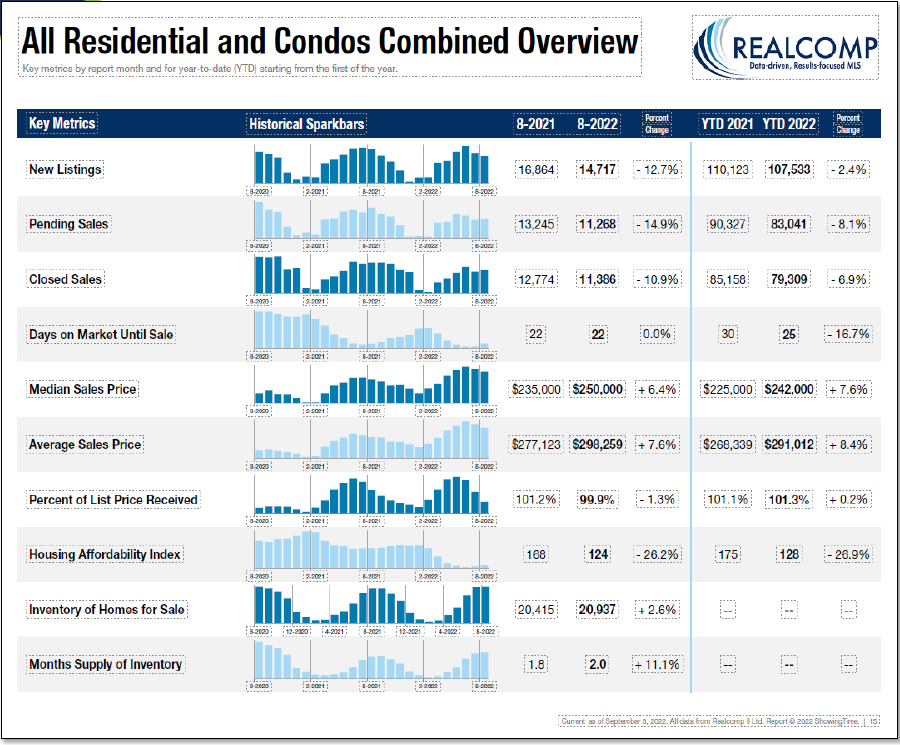
Median Sales Price increased by 6.4% from $235,000 to $250,000.
The average days on market (DOM) stayed the same at 22 days.
The average % of the last list price received decreased by 1.3% from 101.2% to 99.9%.
New Listings decreased by 12.7% from 16,864 to 14,717.
Average Showings per Home decreased by 2 from 10.1 to 8.1.
Pending Sales decreased by 14.9% from 13,245 to 11,268.
Closed Sales decreased by 10.9% from 12,774 to 11,386.
Listings that were both listed and pended in the same month were at 5,135. This represents 34.9% of the new listings for the month and 45.6% of the pended listings.
Months-Supply of Inventory increased by 11.1% from 1.8 to 2.0.
August – Activity by Region or County
The Median Sale Price for the Metro Detroit area (Livingston, Macomb, Oakland, & Wayne combined) increased to $259,990, up by 4.4% over last August, based on 5,185 sales. Listings spent an average of 20 days on the market, up 1 day compared to last August.
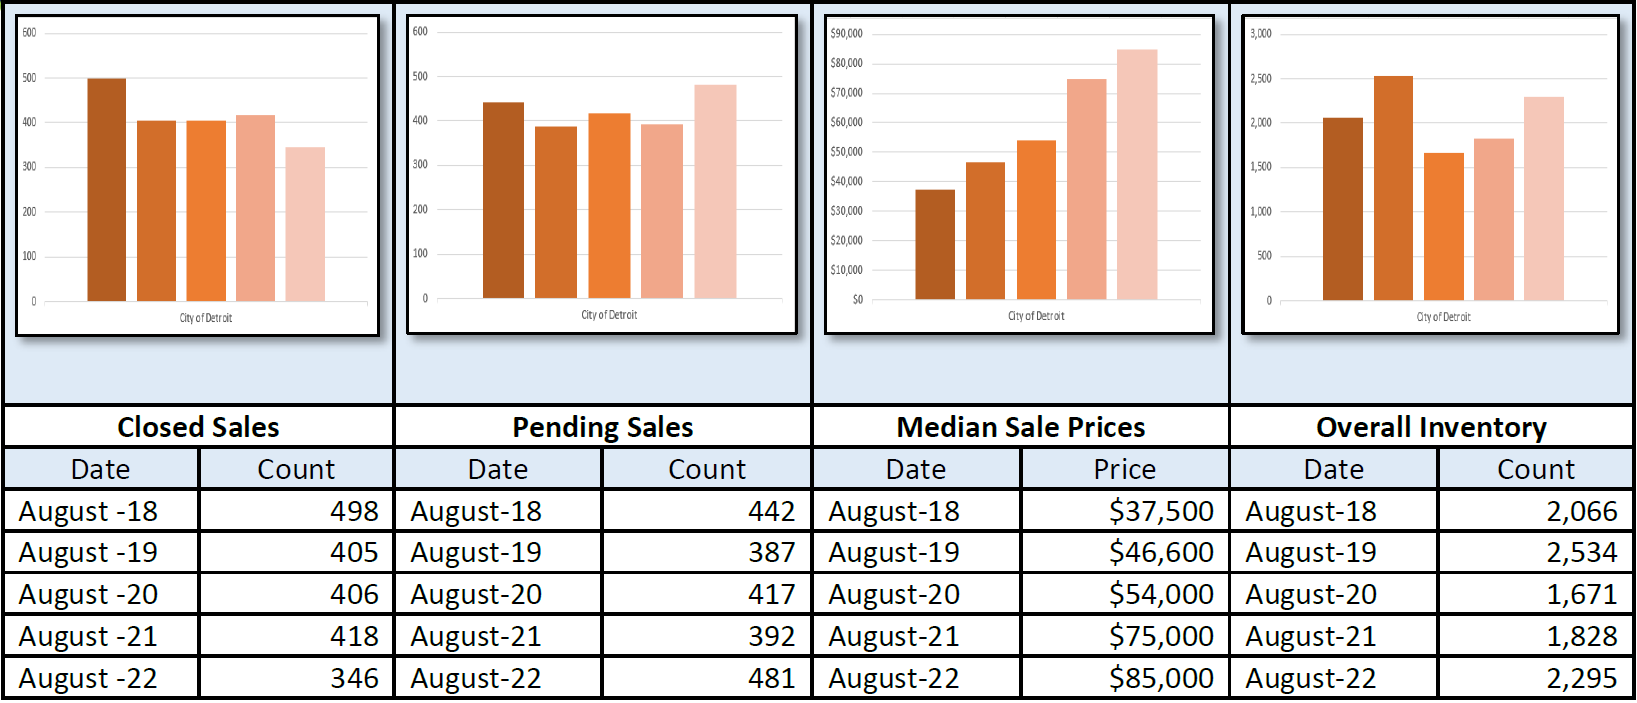
The Median Sale Price for the City of Detroit increased to $85,000, up by 13.3% over last August, based on 346 sales. Listings spent an average of 39 days on the market, up from 28 days compared to last August.
The Median Sale Price for Lapeer County increased to $276,500, up by 11.3% over last August, based on 116 sales. Listings spent an average of 29 days on the market, up 4 days compared to last August.
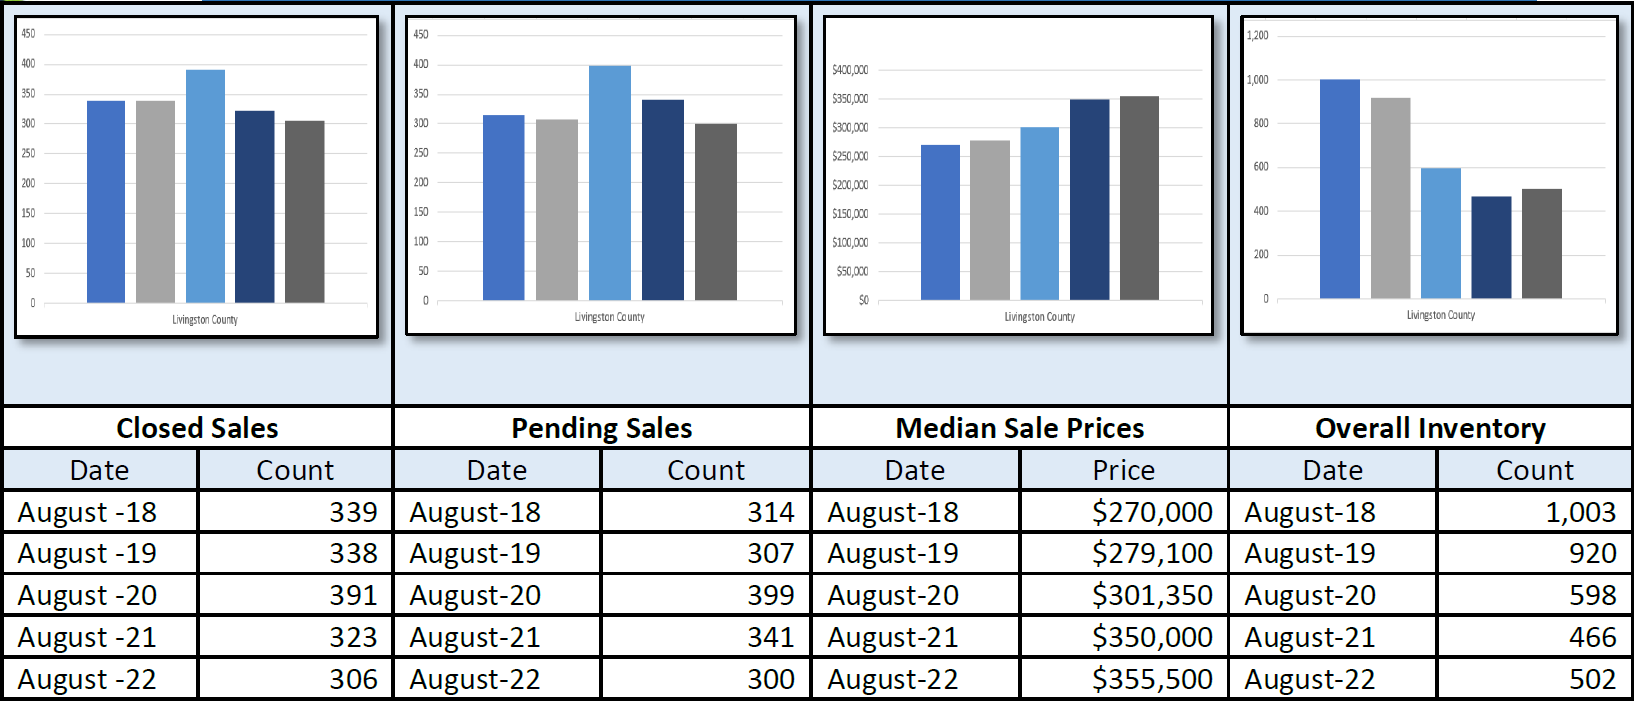
The Median Sale Price for Livingston County increased to $355,500, up by 1.6% over last August, based on 306 sales. Listings spent an average of 22 days on the market, down 2 days compared to last August.
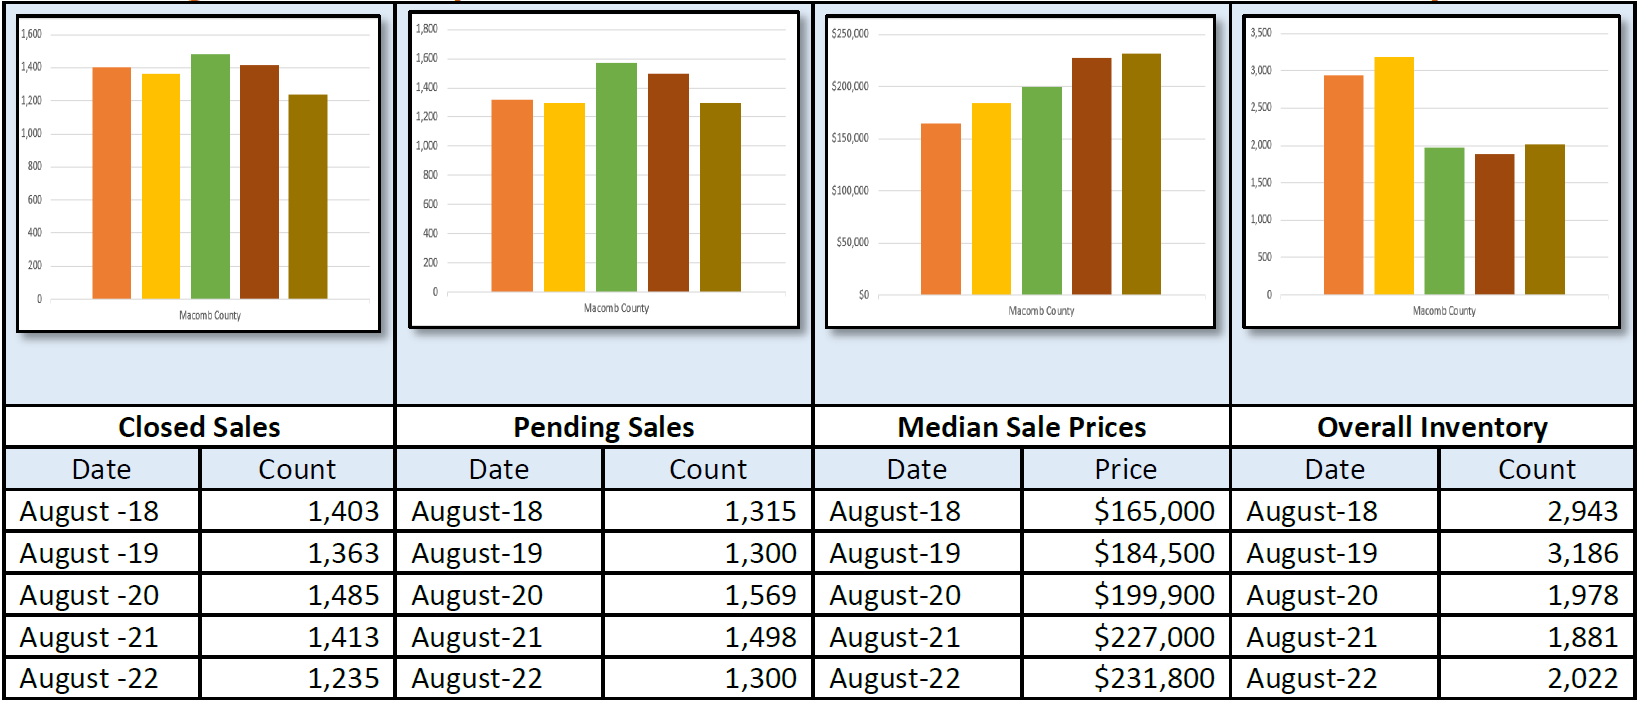
The Median Sale Price for Macomb County increased to $231,800, up by 2.1% over last August, based on 1,235 sales. Listings spent an average of 20 days on the market, up 3 days compared to last August.
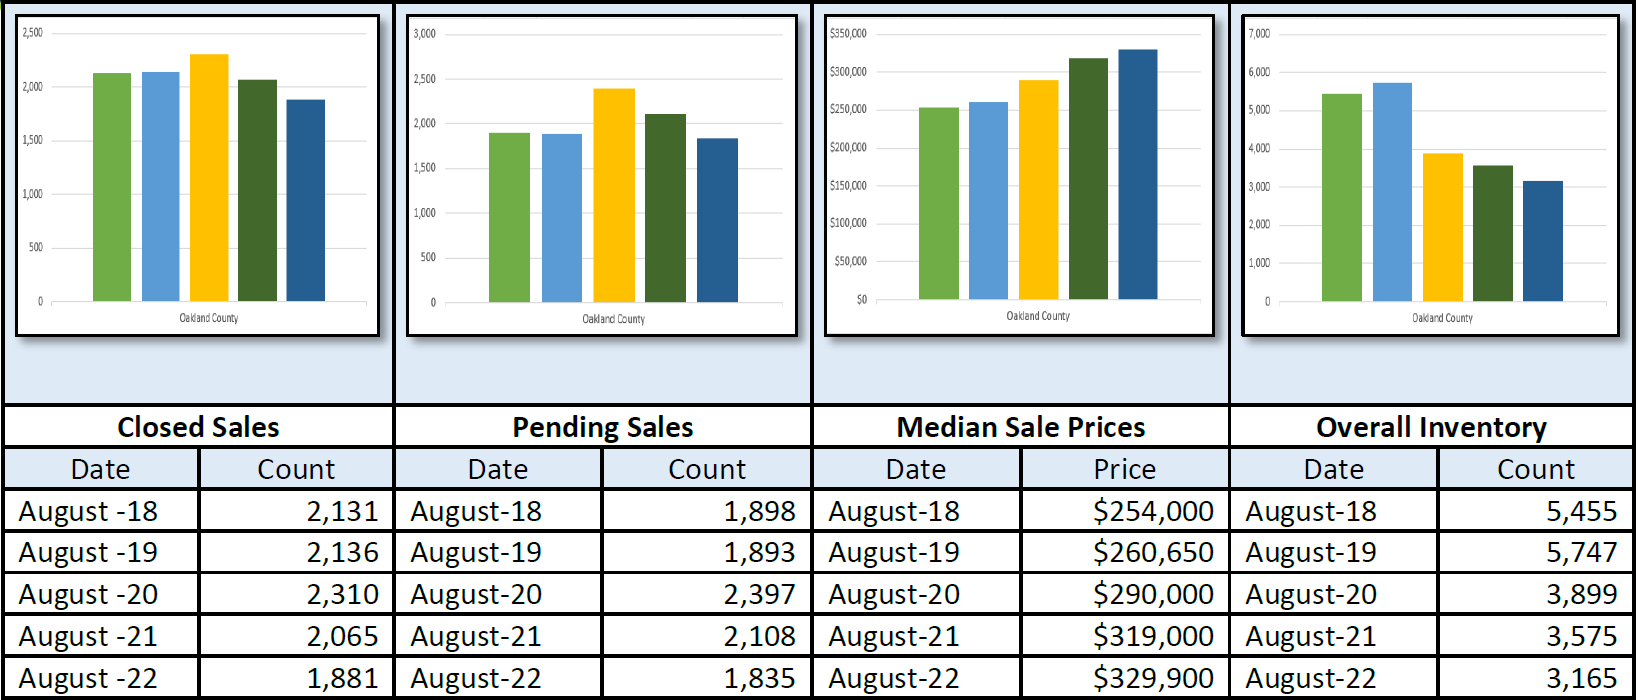
The Median Sale Price for Oakland County increased to $329,900, up by 3.4% over last August, based on 1,881 sales. Listings spent an average of 19 days on the market, down 1 day compared to last August.
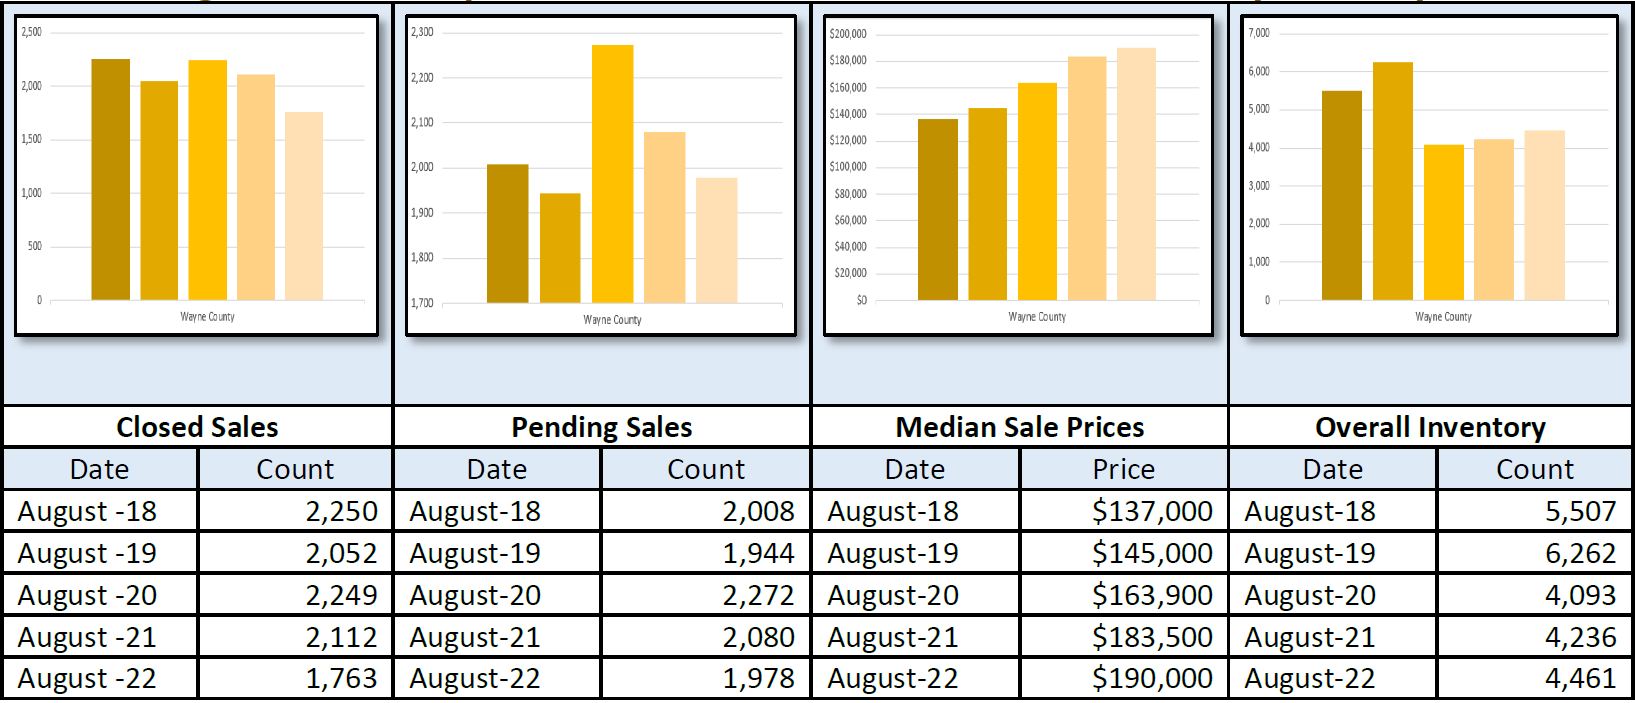
The Median Sale Price for Wayne County increased to $190,000, up by 3.5% over last August, based on 1,763 sales. Listings spent an average of 21 days on the market, up 2 days compared to last August.
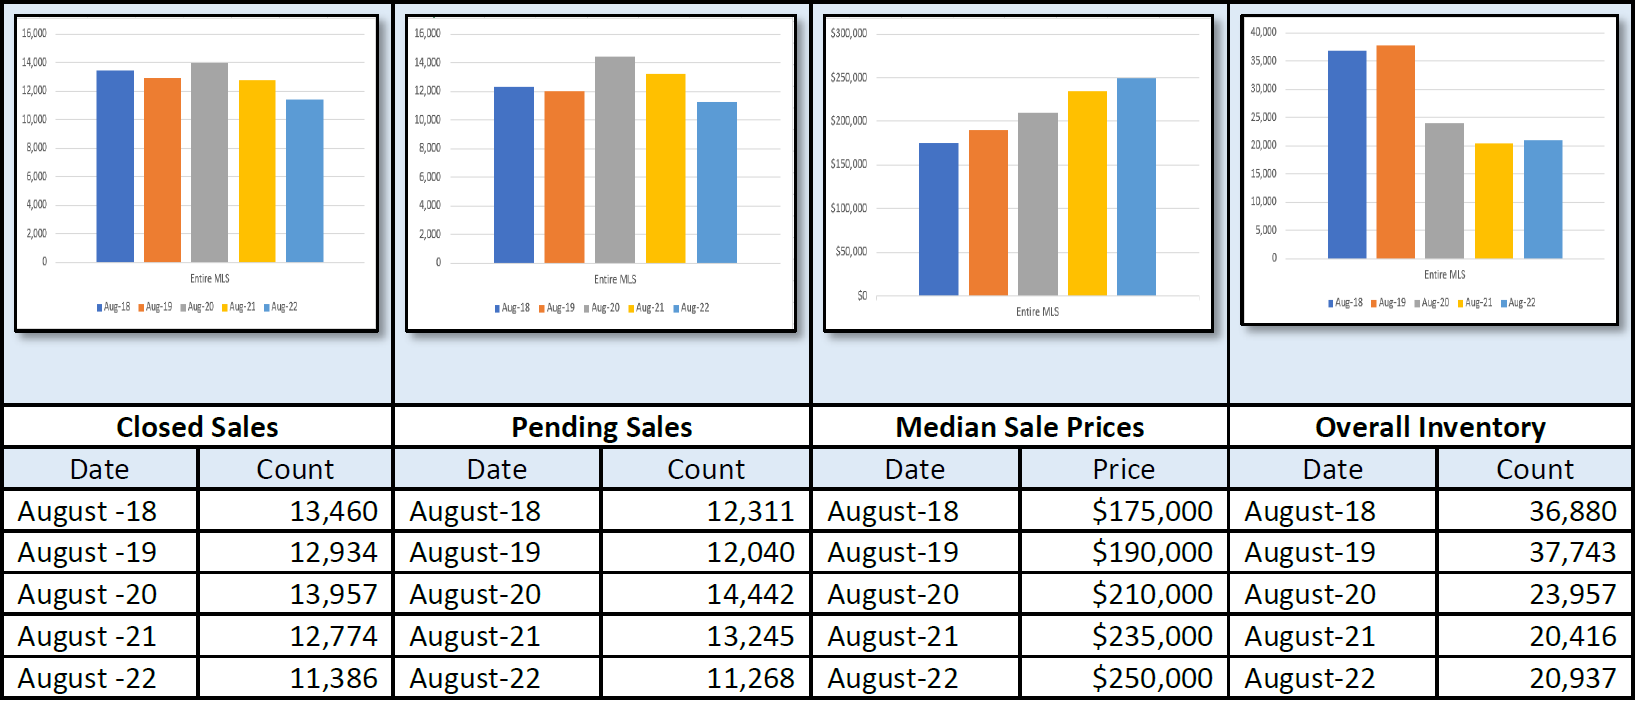
August 5-Year Perspectives -- Residential & Condos Combined -- All MLS
August 5-Year Perspectives -- Residential & Condos Combined -- Livingston County
August 5-Year Perspectives -- Residential & Condos Combined -- Macomb County Numbers
August 5-Year Perspectives -- Residential & Condos Combined -- Oakland County Numbers
August 5-Year Perspectives -- Residential & Condos Combined -- Wayne County Numbers
August 5-Year Perspectives -- Residential & Condos Combined – City of Detroit Numbers
It’s important to note that these numbers present a high level view of what is happening in the real estate market in the lower part of Michigan and in specific regions. Be sure to contact a REALTOR® for their expertise about local markets.
Realcomp Shareholder Boards & Associations of REALTORS®:
- DABOR, 313-278-2220
- DAR, Sharon Armour, EVP, 313-962-1313
- ETAR, Laura VanHouteghen, 810-982-6889
- GMAR, Vickey Livernois, EVP, 248-478-1700
- GPBR, Bob Taylor, CEO, 313-882-8000
- LUTAR, 810-664-0271
- LCAR, Pam Leach, EVP, 810-225-1100
- NOCBOR, Patricia Jacobs, EVP, 248-674-4080