
National Real Estate Commentary
Low inventory, elevated sales prices, and decades-high interest rates continue to weigh on the housing market, causing sales of existing homes to fall to their slowest pace since August 2010. According to the National Association of REALTORS® (NAR), U.S. existing-home sales declined 4.1% month-over-month and 14.6% year-over-year as of last measure, as prospective buyers, faced with rising homeownership costs, wait
for mortgage rates, and home prices, to drop.
Inventory remains at historically low levels nationwide, with only 1.15 million homes for sale heading into November,
a 5.7% decline compared to the same time last year, for a 3.6 months’ supply at the current sales pace. The shortage of available properties for sale has kept pressure on home prices, which have continued to climb despite the slowdown in sales. According to NAR, the U.S. median existing-home sales price increased 3.4% from a year ago to $391,800, an all-time high for the month, with annual price gains reported in all four regions of the country.
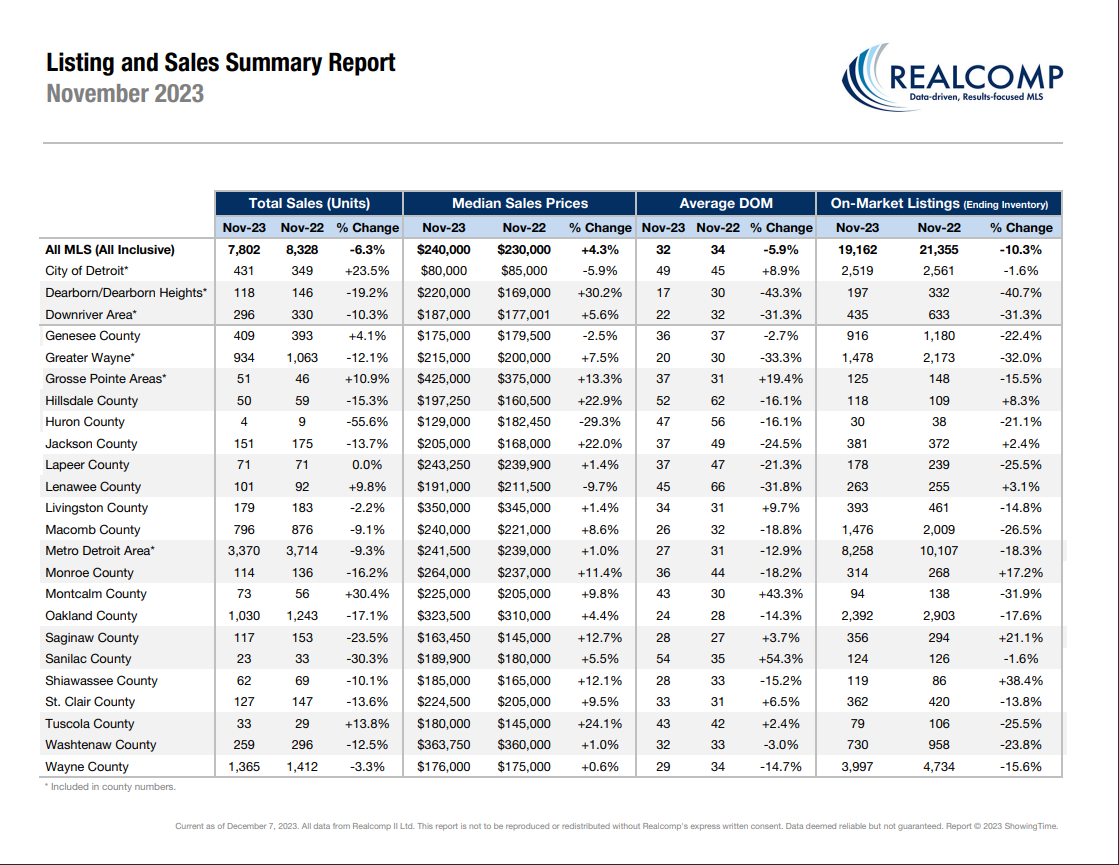
November-Local Activity
Closed Sales decreased 6.5 percent for Residential homes and 4.8 percent for Condo homes. Pending Sales decreased 3.4 percent for Residential homes but increased 5.8 percent for Condo homes. Inventory decreased 11.2 percent for Residential homes and 2.9 percent for Condo homes.
The Median Sales Price increased 7.0 percent to $241,825 for Residential homes but remained flat at $239,950 for Condo homes. Days on Market decreased 3.0 percent for Residential homes and 5.4 percent for Condo homes. Month’s Supply of Inventory remained flat for Residential homes but increased 4.8 percent for Condo homes.
“In November we continued to see the trend of higher median sales prices, along with a slight uptick in new listings and moderate decrease in number of days on market,” said Karen Kage, CEO, Realcomp II Ltd. “It was particularly interesting to see both pending sales and inventory levels rising for Condo homes as potential residential homebuyers consider other options.”
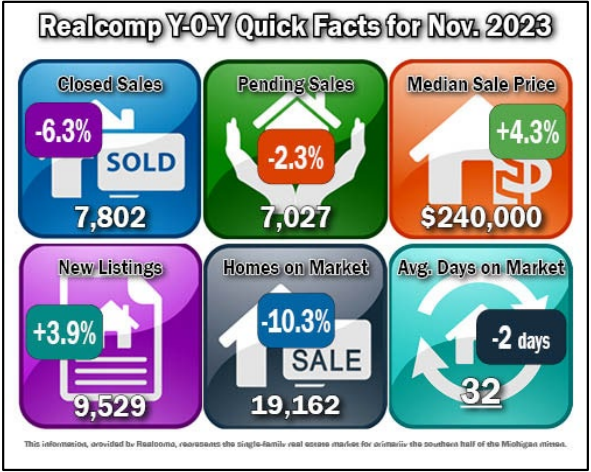
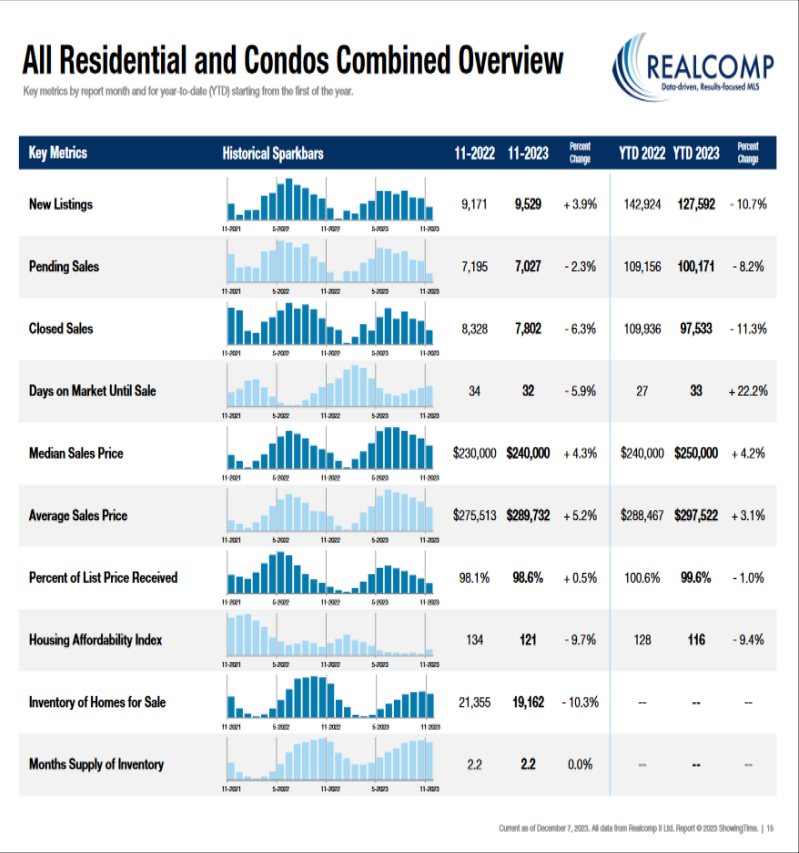
November Y-O-Y Comparison -- Residential & Condos Combined -- All MLS
- New Listings increased by 3.9% from 9,171 to 9,529.
- Pending Sales decreased by 2.3% from 7,195 to 7,027.
- Closed Sales decreased by 6.3% from 8,328 to 7,802.
- Average days on Market (DOM) decreased by 2 days from 34 to 32.
- Median Sale Price increased by 4.3% from $230,000 to $240,000.
- Percent of last list price received increased slightly by .5% from 98.1% to 98.6%.
- Inventory of Homes for Sale decreased by 10.3% from 21,355 to 19,162.
- Months-Supply of Inventory remained the same at 2.2 months.
- Average Showings per Home increased slightly from 5.8 to 6.5.
- Listings that were both listed and pended in the same month were at 2,752. This represents 28.9% of the new listings for the month and 39.2% of the pended listings.
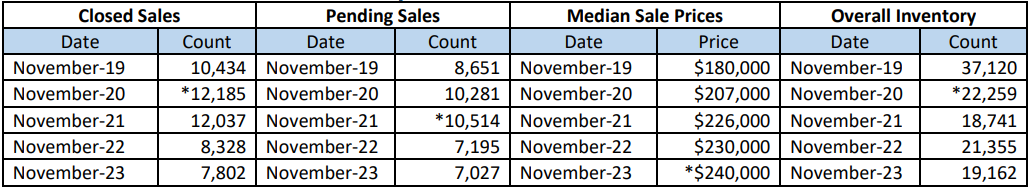
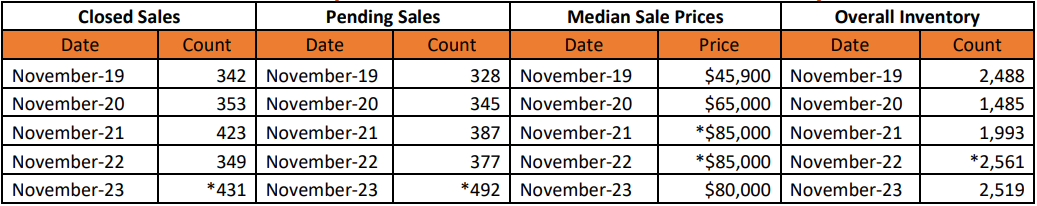
November 5-Year Perspectives -- Residential & Condos Combined -- All MLS
November 5-Year Perspectives -- Residential & Condos Combined – City of Detroit Numbers
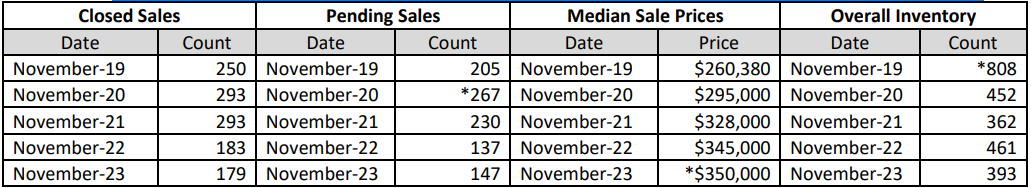
November 5-Year Perspectives -- Residential & Condos Combined -- Livingston County
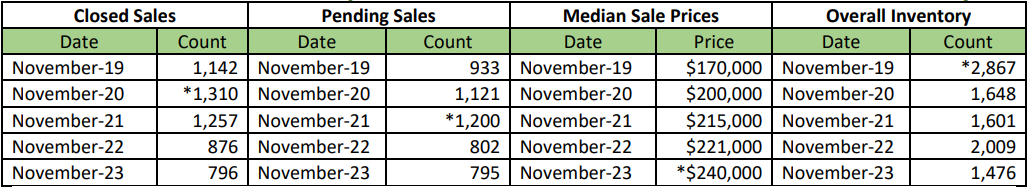
November 5-Year Perspectives -- Residential & Condos Combined -- Macomb County Numbers
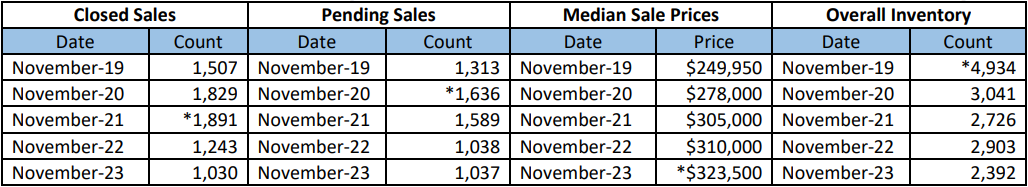
November 5-Year Perspectives -- Residential & Condos Combined -- Oakland County Numbers
November 5-Year Perspectives -- Residential & Condos Combined -- Wayne County Numbers
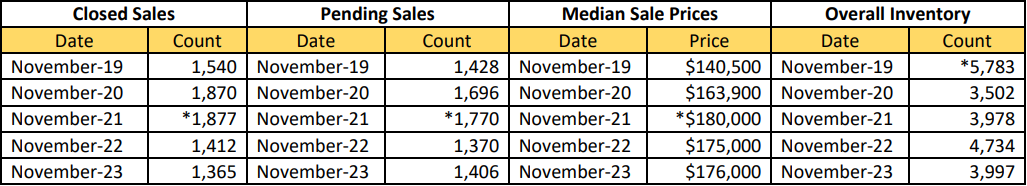
*high points noted with an asterisk.
It’s important to note that these numbers present a high-level view of what is happening in the real estate market in the lower part of Michigan and in specific regions. Be sure to contact a REALTOR® for their expertise about local markets. Find a REALTOR® in your market at www.MoveInMichigan.com.
Realcomp Shareholder Boards & Associations of REALTORS®:
- DABOR, Andrea Kuentz, Interim CEO, 313-278-2220
- DAR, Sharon Armour, EVP, 313-962-1313
- ETAR, Laura VanHouteghen, 810-982-6889
- GPBR, Bob Taylor, CEO, 313-882-8000
- LUTAR, 810-664-0271
- LCAR, Pam Leach, EVP, 810-225-1100
- NOCBOR, Patricia Jacobs, EVP, 248-674-4080