Marketplace Shows Positive Signs of Stabilization
as Inventory of Available Homes on Market Increases
December – National and Local Real Estate Commentary
2022 was a turbulent year for the US housing market, as inflation, soaring interest rates, and elevated sales prices combined to cause a slowdown nationwide. Affordability challenges continue to limit market activity, with pending home sales and existing-home sales down month-over-month and falling 37.8% and 35.4% year-over-year, respectively, according to the National Association of REALTORS® (NAR). Higher mortgage rates are also impacting prospective sellers, many of whom have locked in historically low rates and have chosen to wait until market conditions improve before selling their home.
Closed Sales decreased 32.8 percent for Residential homes and 34.5 percent for Condo homes. Pending Sales decreased 26.3 percent for Residential homes and 33.2 percent for Condo homes. Inventory increased 13.4 percent for Residential homes and 8.6 percent for Condo homes.
The Median Sales Price decreased 2.3 percent to $215,000 for Residential homes but increased 10.0 percent to $230,000 for Condo homes. Days on Market increased 20.0 percent for Residential homes and 25.8 percent for Condo homes. Months-Supply of Inventory increased 30.8 percent for Residential homes and 30.8 percent for Condo homes.
Economists predict sales will continue to slow and housing prices will soften in many markets over the next 12 months, with larger price declines projected in more expensive areas. However, national inventory shortages will likely keep prices from dropping too much, as buyer demand continues to outpace supply, which remains limited at 3.3 months, according to NAR. Even if prices fall, many prospective buyers will find it difficult to afford a home in 2023, as higher rates have diminished purchasing power, adding hundreds of dollars to monthly mortgage payments.
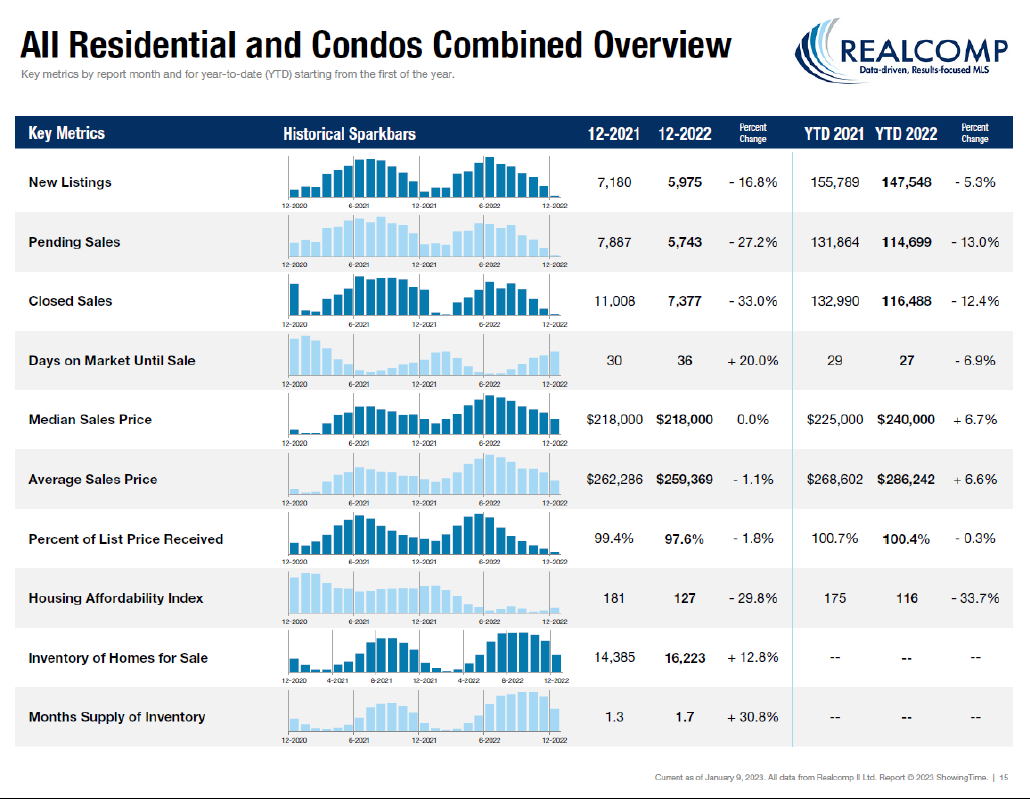
December Y-O-Y Comparison -- Residential & Condos Combined -- All MLS
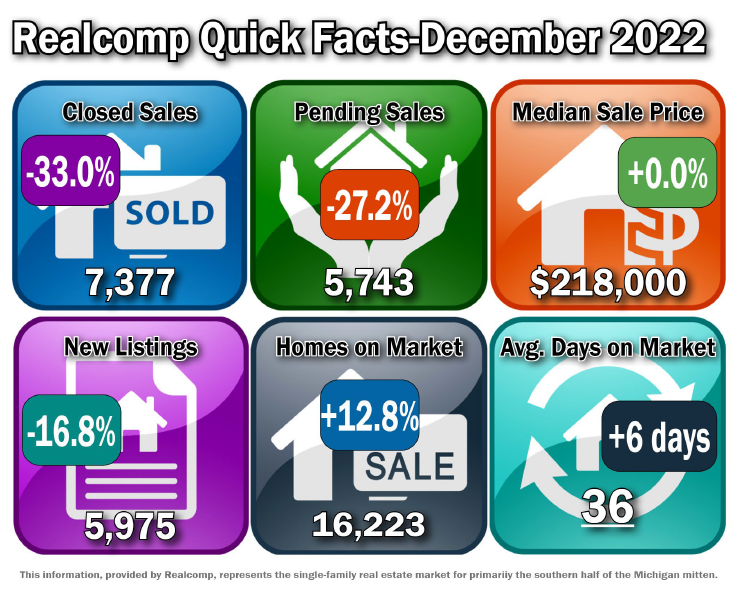
- New Listings decreased by 16.8% from 7,180 to 5,975.
- Pending Sales decreased by 27.2% from 7,887 to 5,743.
- Closed Sales decreased by 33.0% from 11,008 to 7,377.
- Average days on market (DOM) increased by 6 days from 30 to 36.
- Median Sales Price stayed the same at $218,000.
- Percent of last list price received decreased by 1.8% from 99.4% to 97.6%.
- Inventory of Homes for Sale increased by 12.8% from 14,385 to 16,223.
- Months-Supply of Inventory increased by 30.8% from 1.3 to 1.7.
- Average Showings per Home decreased by 3.4 from 9.0 to 5.6.
- Listings that were both listed and pended in the same month were at 1,782. This represents 29.8% of the new listings for the month and 31% of the pended listings.
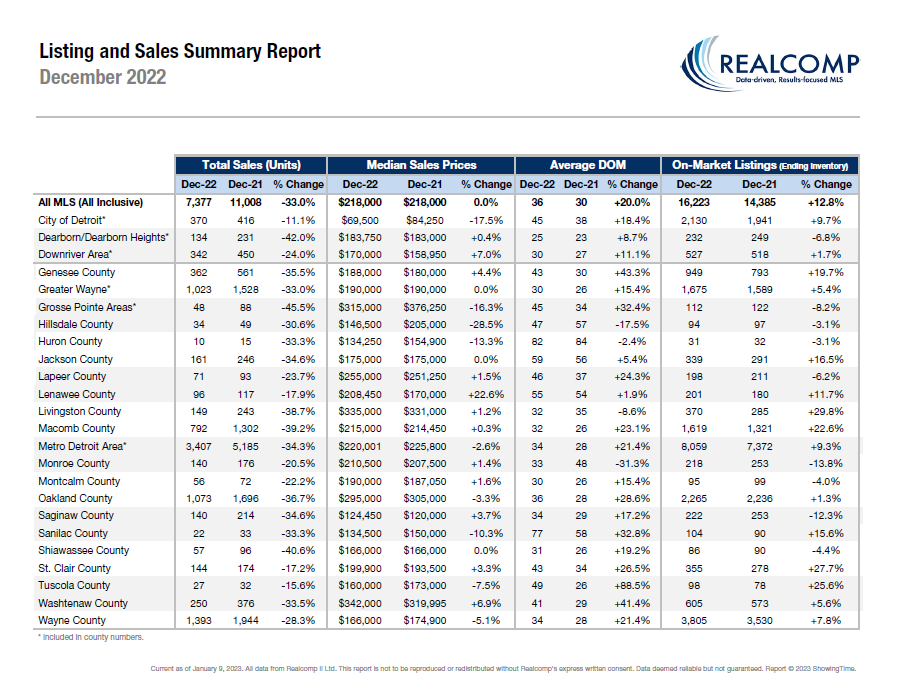
December – Activity by Region or County
- The Median Sale Price for the Metro Detroit area (Livingston, Macomb, Oakland, & Wayne combined) decreased to $220,001, down by 2.6% over last December, based on 3,407 sales. Listings spent an average of 34 days on the market, up 6 days compared to last December.
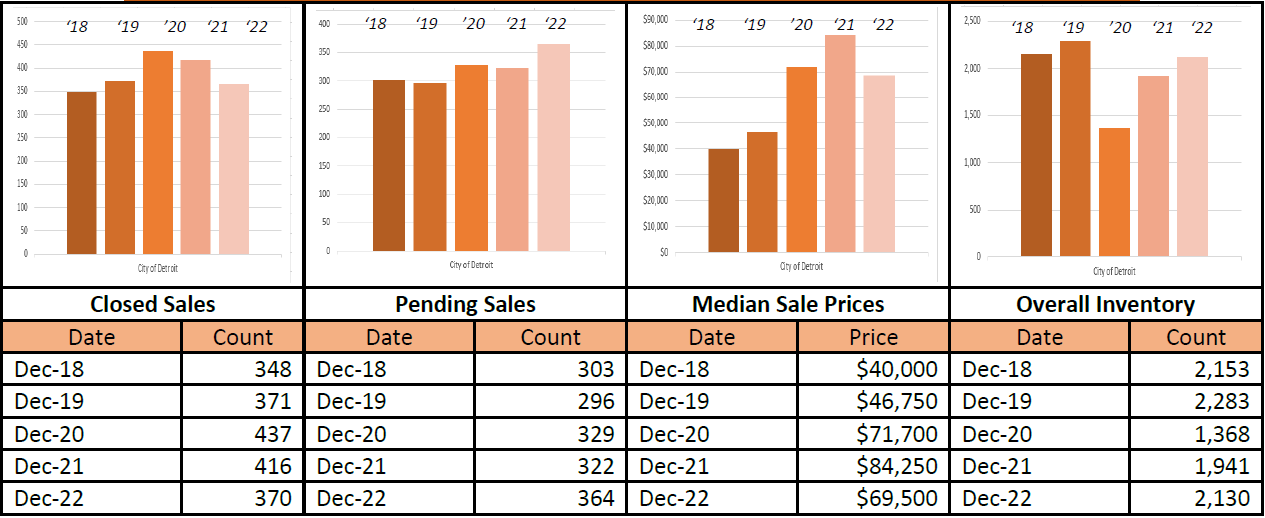
- The Median Sale Price for the City of Detroit decreased to $69,500, down by 17.5% over last December, based on 370 sales. Listings spent an average of 45 days on the market, up by 7 days compared to last December.
- The Median Sale Price for Lapeer County increased to $255,000, up by 1.5% over last December, based on 71 sales. Listings spent an average of 46 days on the market, up by 9 days compared to last December.
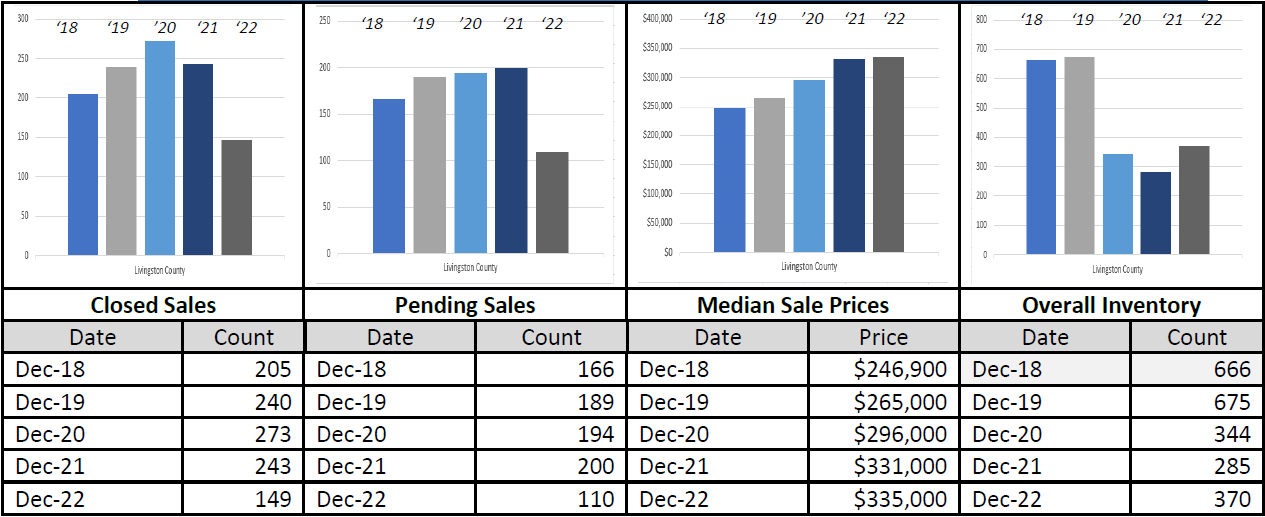
- The Median Sale Price for Livingston County increased to $335,000, up by 1.2% over last December, based on 149 sales. Listings spent an average of 32 days on the market, up by 3 days compared to last December.
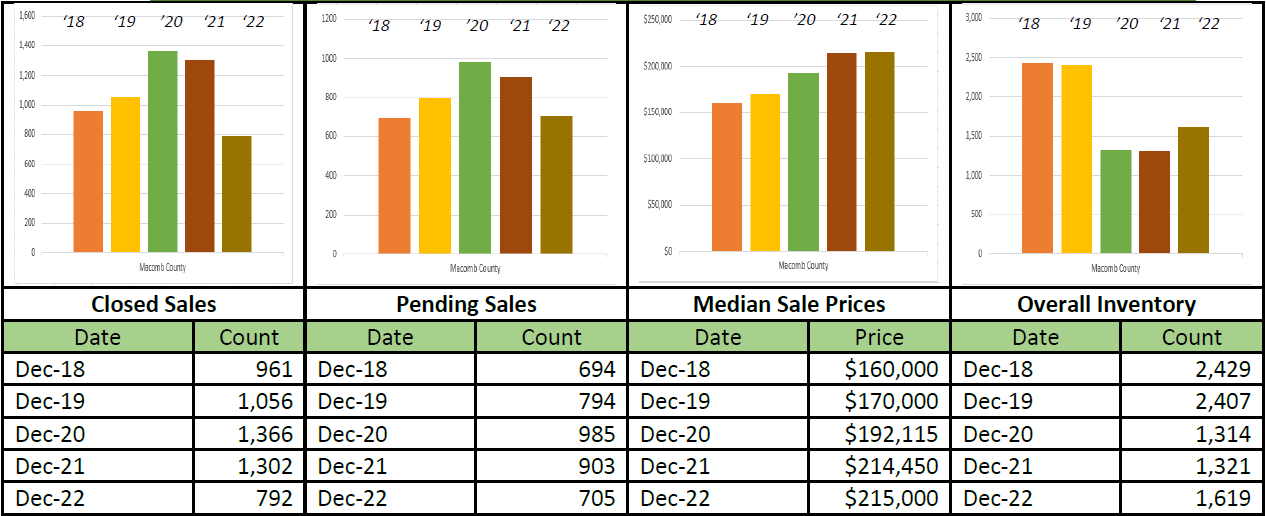
- The Median Sale Price for Macomb County increased to $215,000, up by .3% over last December, based on 792 sales. Listings spent an average of 32 days on the market, up by 6 days compared to last December.
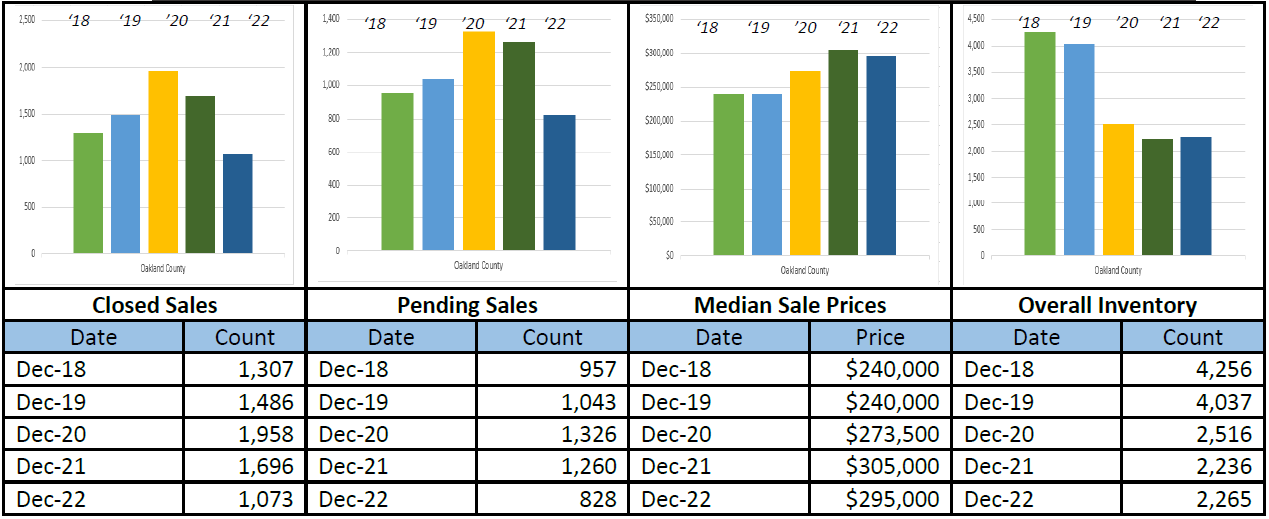
- The Median Sale Price for Oakland County decreased to $295,000, down by 3.3% over last December, based on 1,073 sales. Listings spent an average of 36 days on the market, up by 8 days compared to last December.
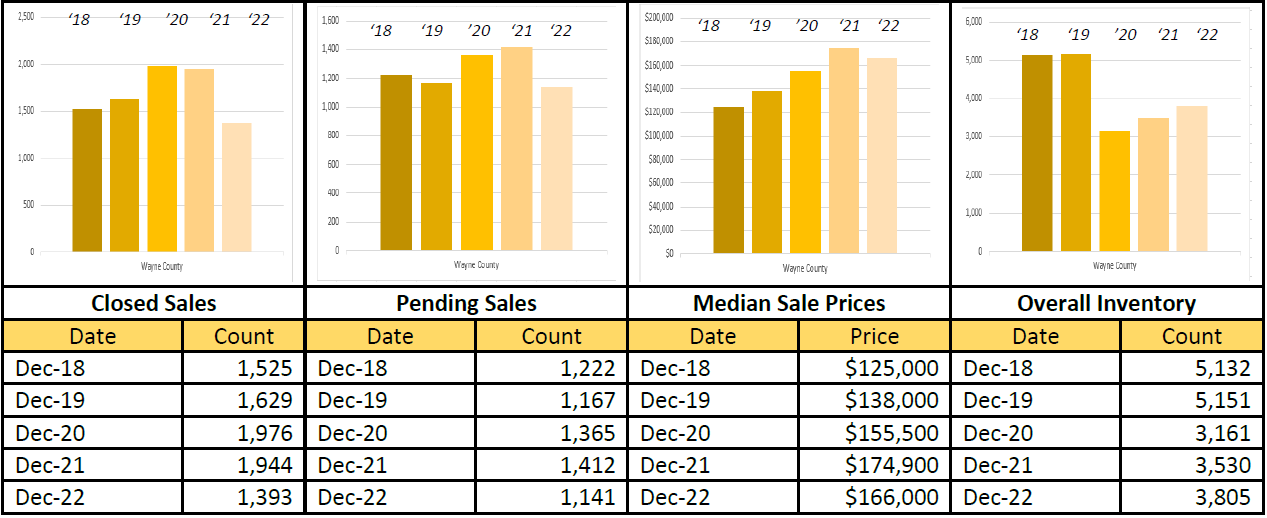
- The Median Sale Price for Wayne County decreased to $166,000, down by 5.1% over last December, based on 1,393 sales. Listings spent an average of 34 days on the market, up by 6 days compared to last December.
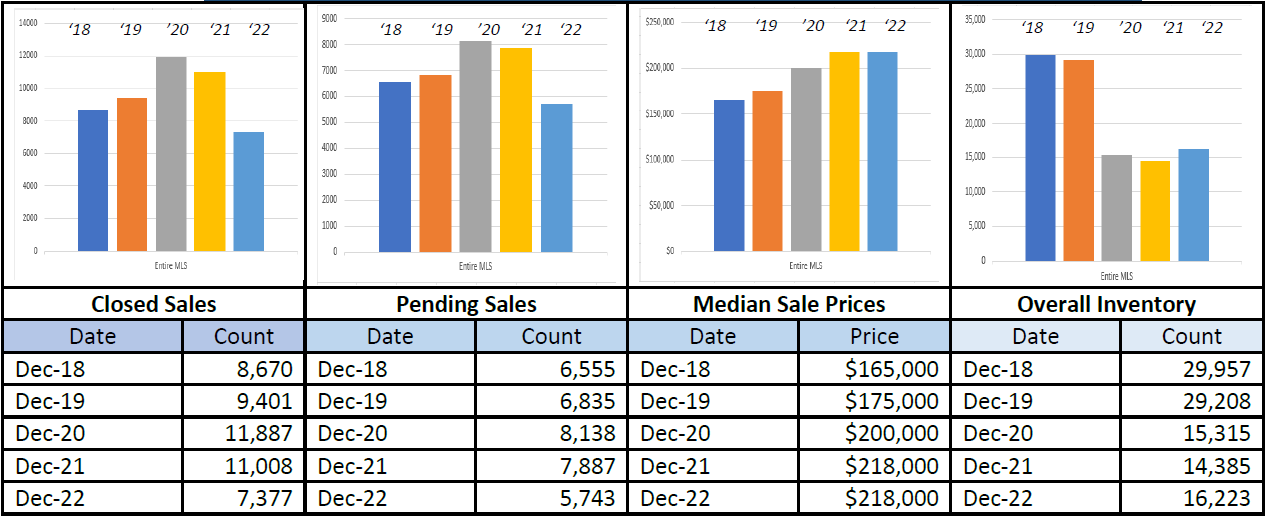
December 5-Year Perspectives -- Residential & Condos Combined -- All MLS
December 5-Year Perspectives -- Residential & Condos Combined -- Livingston County
December 5-Year Perspectives -- Residential & Condos Combined -- Macomb County Numbers
December 5-Year Perspectives -- Residential & Condos Combined -- Oakland County Numbers
December 5-Year Perspectives -- Residential & Condos Combined -- Wayne County Numbers
December 5-Year Perspectives -- Residential & Condos Combined – City of Detroit Numbers
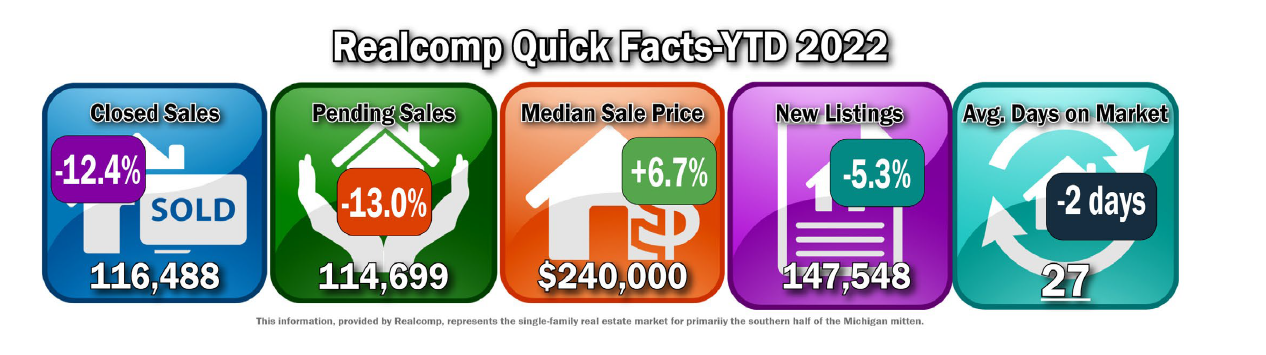
December YTD Totals – Local All MLS Numbers
- Closed Sales were down by 12.4% from 132,990 to 116,488.
- Pending Sales were down by 13.0% from $131,864 to 114,699.
- Median Sale Price increased by 6.7% from $225,000 to $240,000.
- The average % of the last list price received decreased by .3% from 100.7% to 100.4%.
- New Listings decreased by 5.3% from 155,789 to 147,548.
- Average days on market (DOM) decreased by 2 days from 29 to 27 days.
It’s important to note that these numbers present a high-level view of what is happening in the real estate market in the lower part of Michigan and in specific regions. Be sure to contact a REALTOR® for their expertise about local markets.
Realcomp Shareholder Boards & Associations of REALTORS®:
- DABOR, Erin Richard, CEO, 313-278-2220
- DAR, Sharon Armour, EVP, 313-962-1313
- ETAR, Laura VanHouteghen, 810-982-6889
- GMAR, Vickey Livernois, EVP, 248-478-1700
- GPBR, Bob Taylor, CEO, 313-882-8000
- LUTAR, 810-664-0271
- LCAR, Pam Leach, EVP, 810-225-1100
- NOCBOR, Patricia Jacobs, EVP, 248-674-4080