
National Real Estate Commentary
U.S. sales of existing homes recently fell to a 13-year low, dropping 2.0% month-over-month and 15.4% year-over-year as of last measure, according to the National Association of REALTORS® (NAR), as surging interest rates and elevated sales prices continue to make homeownership challenging for many prospective buyers. Purchase activity is down significantly compared to this time last year, but rising interest rates are also keeping many current homeowners from selling, causing inventory to remain at historically low levels nationwide.
Total housing inventory going into October was at 1.13 million units, up 2.7% from the previous month but down 8.1% compared to the same time last year, for a 3.4 months’ supply at the current sales pace, according to NAR. The shortage of homes for sale is making it harder for buyers to find a home to purchase while at the same time pushing sales prices higher nationwide, with the median existing-home sales price rising 2.8% annually to $394,300, the third consecutive month of year-over-year price increases.
October-Local Activity
Closed Sales decreased 6.8 percent for Residential homes and 12.0 percent for Condo homes. Pending Sales decreased 1.5 percent for Residential homes and 2.5 percent for Condo homes. Inventory decreased 13.7 percent for Residential homes and 3.9 percent for Condo homes.
The Median Sales Price increased 6.4 percent to $250,000 for Residential homes and 6.4 percent to $250,000 for Condo homes. Days on Market remained flat for Residential homes but decreased 14.7 percent for Condo homes. Months-Supply of Inventory decreased 4.3 percent for Residential homes but increased 4.8 percent for Condo homes.
“Market factors such as low inventory and higher interest rates continued to affect our MLS market area, as they did the rest of the country,” said Karen Kage, CEO, Realcomp II Ltd. “The slight uptick in new listings and the positive movement in pending sales activity (although still down compared to last year) were encouraging to see.
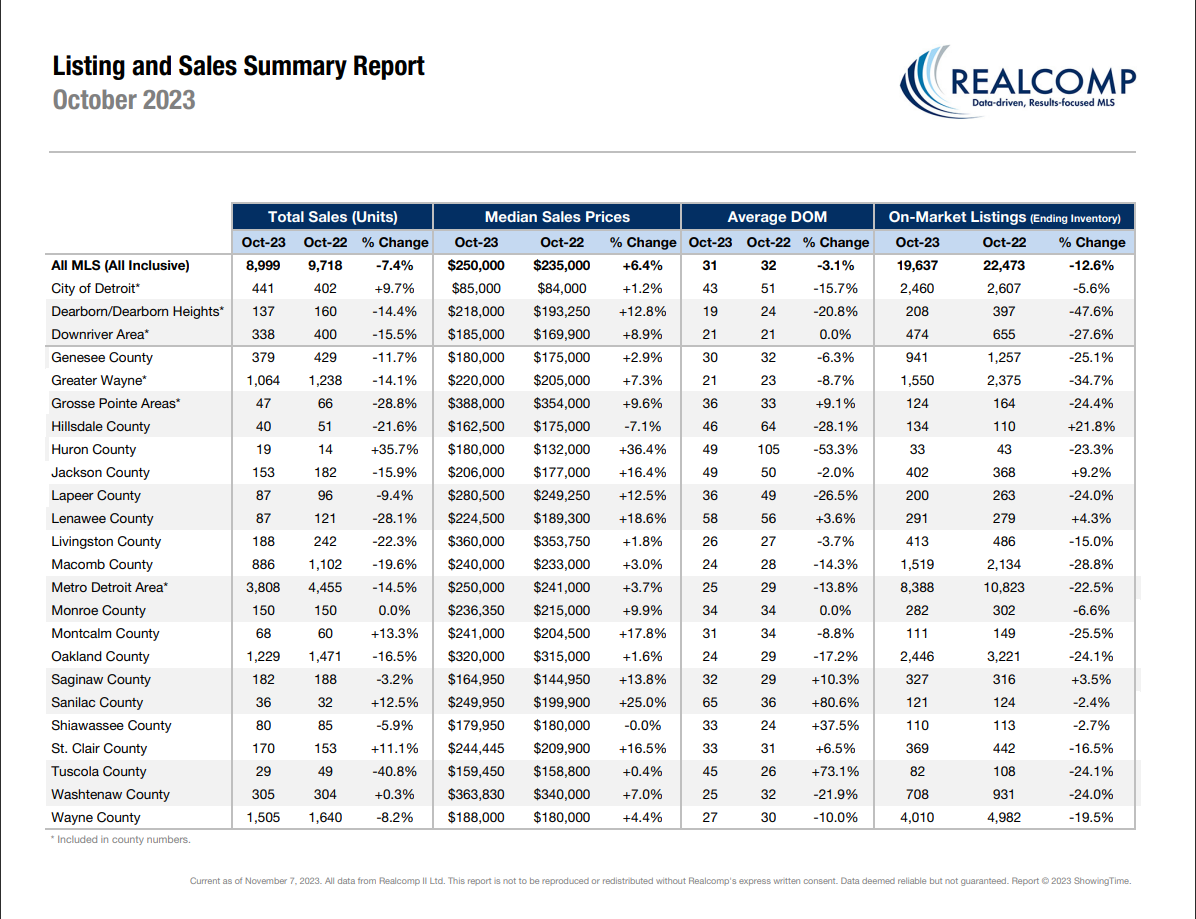
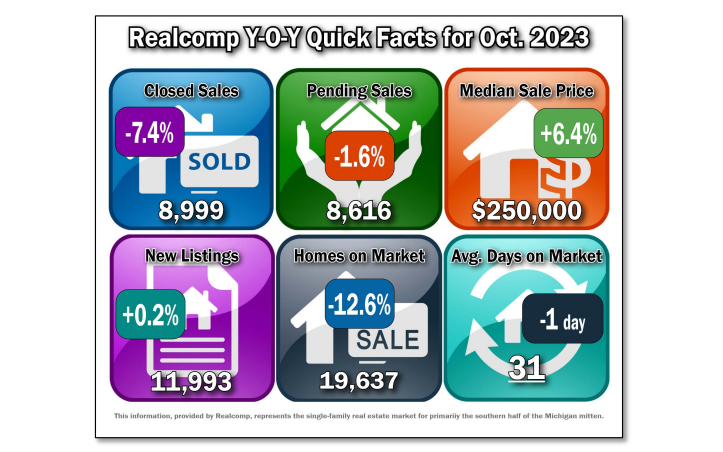
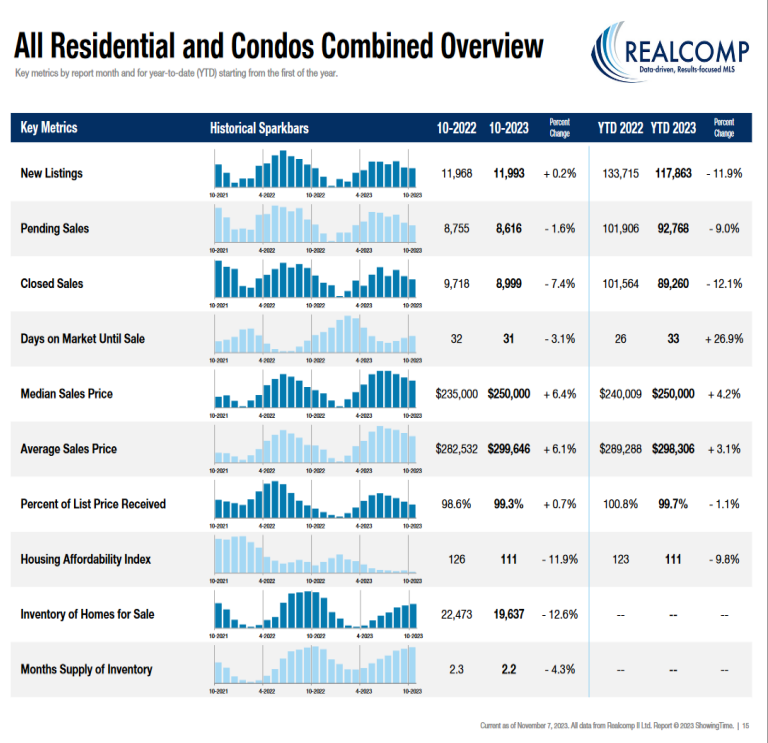
October Y-O-Y Comparison -- Residential & Condos Combined -- All MLS
- New Listings increased by 0.2% from 11,968 to 11,993.
- Pending Sales decreased by 1.6% from 8,755 to 8,616.
- Closed Sales decreased by 7.4% from 9,718 to 8,999.
- Average days on Market (DOM) decreased by 1 day from 32 to 31.
- Median Sale Price increased by 6.4% from $235,000 to $250,000.
- Percent of last list price received increased slightly by .7% from 98.6% to 99.3%.
- Inventory of Homes for Sale decreased by 12.6% from 22,473 to 19,637.
- Months-Supply of Inventory decreased by 4.3% from 2.3 to 2.2.
- Average Showings per Home increased slightly from 6.3 to 7.1.
- Listings that were both listed and pended in the same month were at 3,752. This represents 31.3% of the new listings for the month and 43.5% of the pended listings.
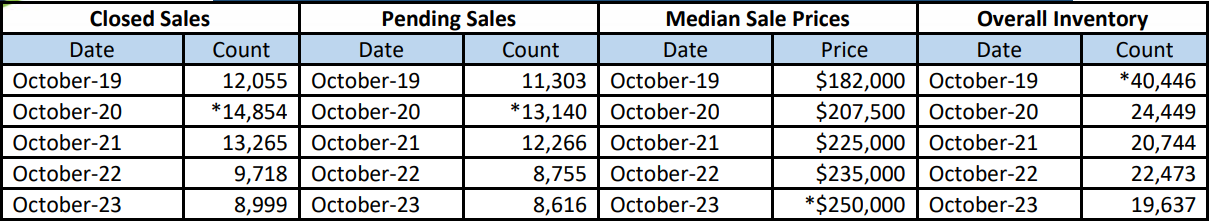
October 5-Year Perspectives -- Residential & Condos Combined -- All MLS
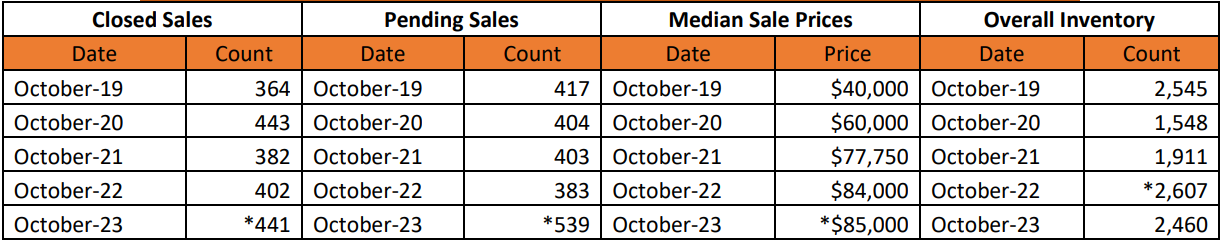
October 5-Year Perspectives -- Residential & Condos Combined – City of Detroit Numbers
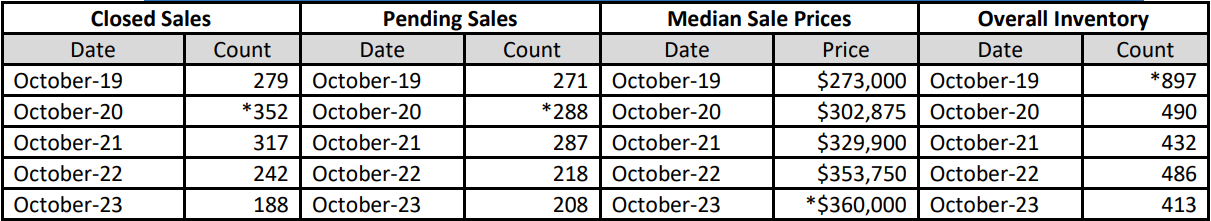
October 5-Year Perspectives -- Residential & Condos Combined -- Livingston County
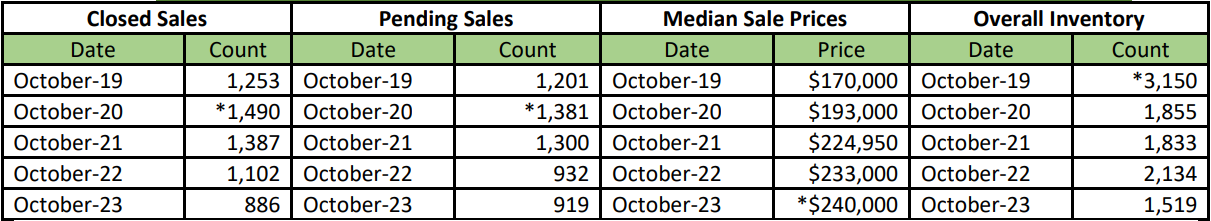
October 5-Year Perspectives -- Residential & Condos Combined -- Macomb County Numbers
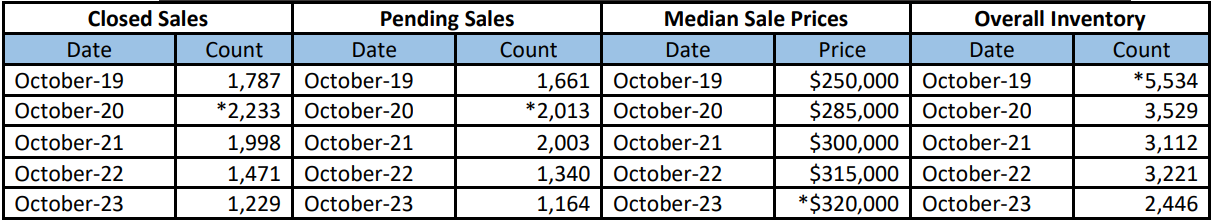
October 5-Year Perspectives -- Residential & Condos Combined -- Oakland County Numbers
October 5-Year Perspectives -- Residential & Condos Combined -- Wayne County Numbers
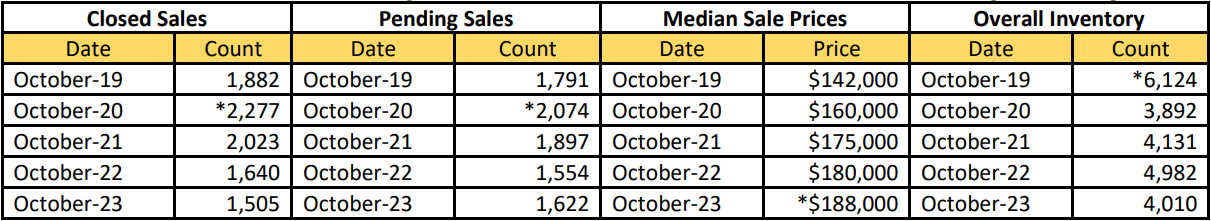
*high points noted with an asterisk.
It’s important to note that these numbers present a high-level view of what is happening in the real estate market in the lower part of Michigan and in specific regions. Be sure to contact a REALTOR® for their expertise about local markets. Find a REALTOR® in your market at www.MoveInMichigan.com.
Realcomp Shareholder Boards & Associations of REALTORS®:
- DABOR, Andrea Kuentz, Interim CEO, 313-278-2220
- DAR, Sharon Armour, EVP, 313-962-1313
- ETAR, Laura VanHouteghen, 810-982-6889
- GPBR, Bob Taylor, CEO, 313-882-8000
- LUTAR, 810-664-0271
- LCAR, Pam Leach, EVP, 810-225-1100
- NOCBOR, Patricia Jacobs, EVP, 248-674-4080