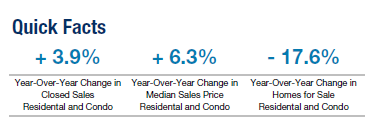
Summer Of (House) Love: Median Home Sale Prices Up 6.3%
Sales Increase by 3.9% in July Despite Lower Inventory
Real Estate Market Commentary for July 2018:
The chatter about housing price bubbles has increased this summer, as observers attempt to predict the next shift in the residential real estate market. It is far too early to predict a hard shift away from higher prices and lower inventory, but the common markers that caused the last housing market downturn are essentially present. Wages are up but not at the same pace as home prices, leading to the kind of affordability concerns that lead to lower sales at lower prices. At the same time, demand is still outpacing what is available for sale in many markets.
Consumer spending on home goods and renovations are up, while more people enter the workforce. Employed
people spending money is generally good for residential real estate. Meanwhile, GDP growth was 4.1% in the
second quarter, the strongest showing since 2014. Housing starts are down, but that is more reflective of low
supply than anything else. With a growing economy, stronger lending practices and the potential for improved
inventory from new listing and building activity, market balance is more likely than a bubble.
Single-Family Real Estate Quick Comparisons:
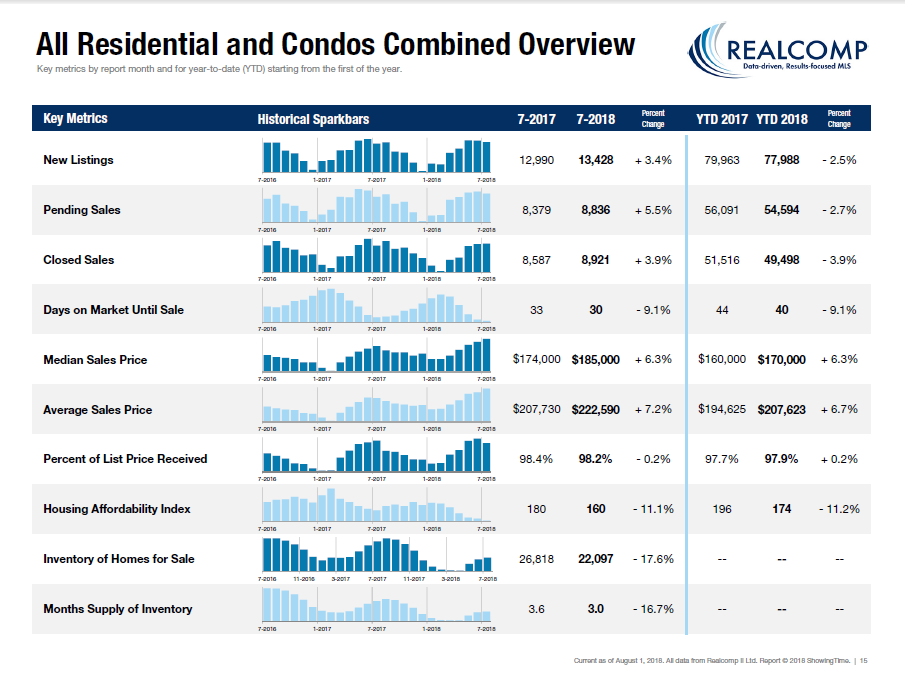
- Days on Market decreased by three (3) days overall in July, from 33 in 2017 to 30 in 2018.
- There were an average of seven (7) showings per listing across the entire MLS during July. This was up by 1.4% Y-O-Y and down by 8.8% M-O-M.
- 2.8% of Residential and Condo On-Market listings are flagged as “lender mediated”. These listings include foreclosures and those marked as short sales. This percentage is down by 1.7% based on the recalculated percentage for July 2017, which is 4.5%.
- The percentage of lender mediated listings is down by .3% M-O-M (compared to June, which was 3.1%).
Five Year (5) June Comparisons
Five (5) Year Comparison of Median Sales Price for July
| |
July-13* |
July-14* |
July-15* |
July-16* |
July-17* |
July-18 |
5-Year Diff |
| All MLS |
$120,000 |
$140,000 |
$154,000 |
$161,000 |
$174,000 |
$185,000 |
54% |
| City of Detroit |
$13,000 |
$15,500 |
$19,500 |
$25,750 |
$30,500 |
$34,738 |
167% |
| Genesee County |
$84,900 |
$105,000 |
$125,000 |
$130,000 |
$140,000 |
$156,950 |
85% |
| Lapeer County |
$132,000 |
$135,000 |
$140,000 |
$162,000 |
$191,250 |
$188,950 |
43% |
| Livingston County |
$184,496 |
$196,350 |
$225,000 |
$232,000 |
$259,950 |
$279,900 |
52% |
| Macomb County |
$109,000 |
$132,613 |
$143,000 |
$149,900 |
$155,000 |
$171,000 |
57% |
| Oakland County |
$185,000 |
$207,875 |
$211,000 |
$220,000 |
$248,000 |
$250,000 |
35% |
| St. Clair County |
$96,500 |
$125,000 |
$132,000 |
$140,360 |
$143,500 |
$166,450 |
73% |
| Wayne County |
$77,410 |
$100,000 |
$119,000 |
$127,500 |
$136,500 |
$144,200 |
86% |
| Washtenaw County |
$200,000 |
$220,000 |
$237,500 |
$247,000 |
$261,500 |
$295,000 |
48% |
* = Recalculated figures pulled from Realcomp’s MLS statistical database as of 8/7/2018.