Did you know, Realcomp provides seven (7) different statistical report options via our FastStats statistical report tool (shown below)?
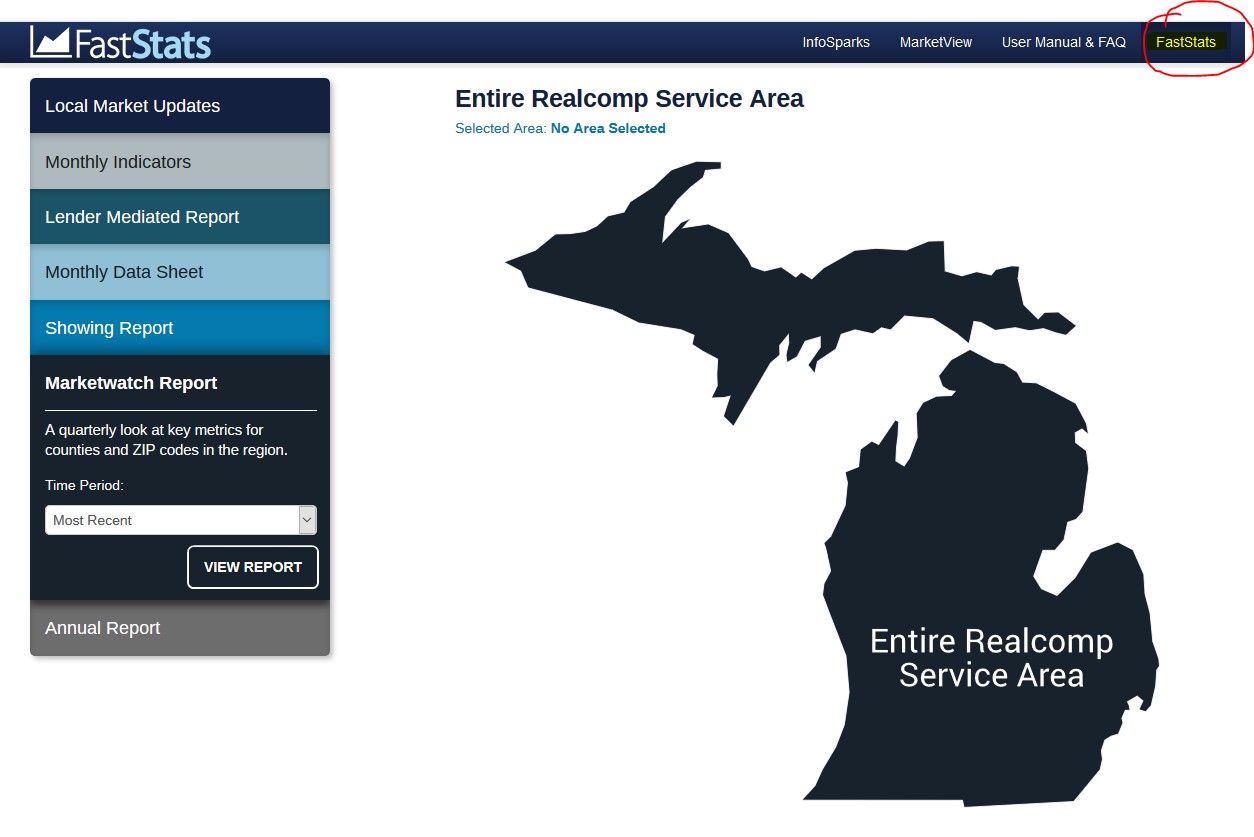
Realcomp’s statistical reports allow you to review, compare, and analyze real estate-related metrics (i.e. listings, sales, showings, median price, average price, days on market, and more) over various lengths of time and markets to inform and advise your customers and clients regarding their buying and selling decisions.
Our FastStat reports include:
-
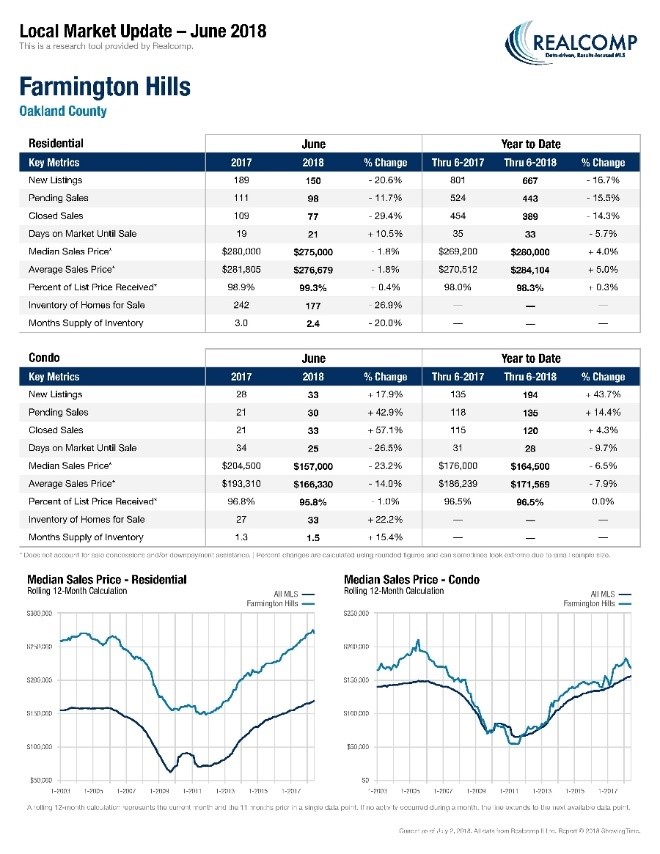
Local Market Updates – A one (1) page report on Residential and Condominium listing and sales activities for the month and YTD compared to the same month and YTD timeframe for last year. Local Market Updates can be pulled for cities, villages, and townships across a 14-county area. The report can also be pulled for each county and various other pre-defined jurisdictions. The report includes a rolling 12-month calculation and graph for median sale price activity over the last 14 years.
Usage Tip: Consider including this report in an upcoming CMA to inform your seller of the overall trends for an area. Then, compare that to their particular home.
-
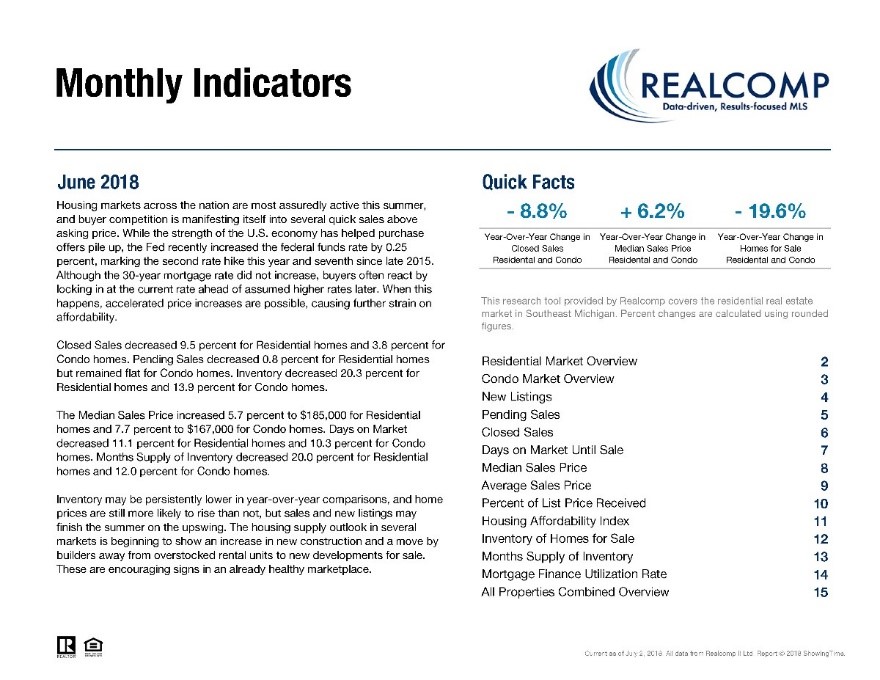
Monthly Indicators – A 15-page report on Residential and Condominium listing and sales activities for the month and YTD compared to the same month and YTD timeframe for the last 2 years. This report is based on activity for the entire MLS. The report also provides economic commentary on the real estate market and 14-year historical graphs on many market indicators (i.e. new listings, pending listings, closed sales, days on market, average sales price, median sales price, percent of list price received, inventory, months supply of inventory, and more). The report also includes a Housing Affordability Index which measures housing affordability for the region, taking into account the median household income and what is necessary to qualify for the median-priced home under prevailing interest rates. The higher the number, the greater the affordability.
Usage Tip: This may be an index you share with consumers through your website and/or other marketing pieces.

-
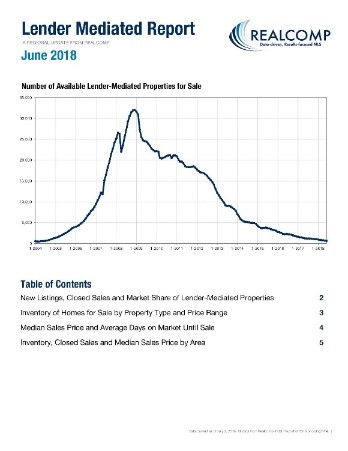
Lender Mediated Report – A five (5) page report that allows you to compare traditional sales to foreclosure and short sales for the region.
Usage Tip: Is the market share of lender mediated Residential and Condominium sales still declining? Reference this report to know for sure!
-
Monthly Data Sheet - A one (1) page snapshot that briefly summarizes the total sales, median sale price, average days on market (DOM) and on-market listing inventory by county or other jurisdiction for the month and compares it to the same month last year.
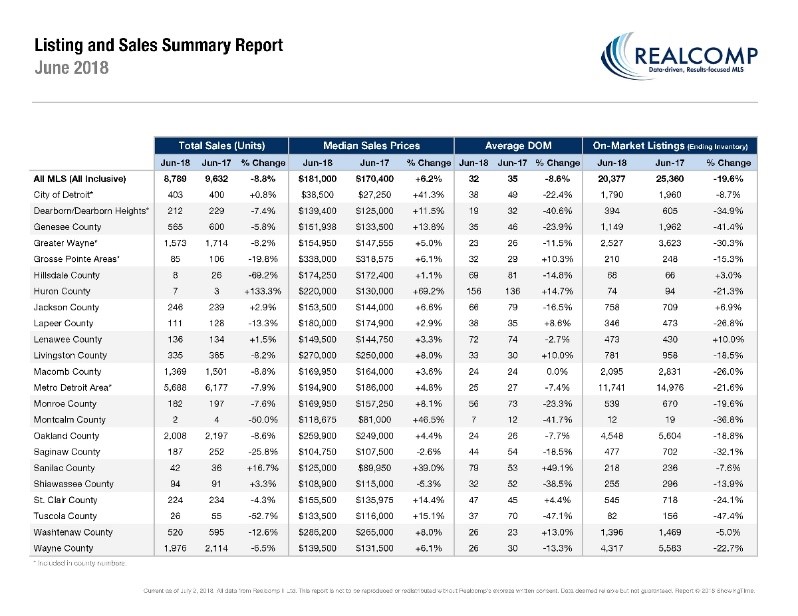
Usage Tip: Keep tabs on the market, in multiple counties and other jurisdictions, by reviewing the latest numbers and comparing them to the same month last year.
-
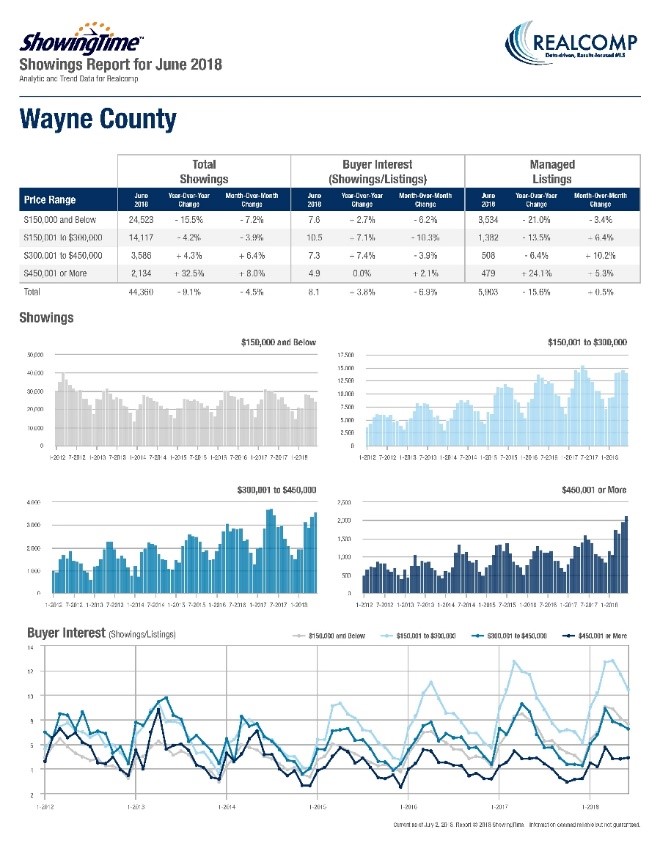
Showing Report – A one (1) page report, broken down by county and other jurisdictions, that summarizes the number of showings conducted through ShowingTime, and showings per four (4) specific price ranges.
Usage Tip:Let your sellers know the average number of showings that took place per listing last month. Your buyers may appreciate knowing this number too when going to see properties.
-
Marketwatch Report – A 39-page report, broken down by county and zip code, that provides metrics for the quarter. Monthly numbers are great, but numbers for the quarter paint a more complete picture!
Usage Tip: Share metrics by zip code with consumers visiting your website! Collect their contact information first and then provide them with the quarterly Marketwatch report and your contact information so you can keep them in the know about the real estate market.
-
Annual Report – Check out highs and lows for the entire region and broken down by county via this 10-page report.
Usage Tip: Reference the economic outlook for the year to come based on last year’s performance and economic indicators that are likely to impact the future.
The FastStats function can be found under the ShowingTime MarketStats menu item  on the Realcomp dashboard.